PredictTheBall: Premier League Predictions
A Premier League table prediction game with private leagues, live scoring and an Elo benchmark that simulates the remaining season 10,000 times. Built with React and Flask, and deployed on Oracle Cloud Infrastructure.
Football predictions tend to improve considerably once the matches have been played. By May, everyone apparently knew who would win the league. The table they actually picked in August is usually harder to find.
I built PredictTheBall to keep that table somewhere inconveniently permanent. You predict the finishing order of all 20 Premier League clubs, join leagues with friends, and spend the season watching your confidence get converted into a numerical score.
There is also an Elo forecasting model running alongside the game. It produces finishing-position probabilities and gives players a benchmark to compare themselves against. Between that and the accounts, private leagues and deployment, this became quite a lot of code for an argument about football.
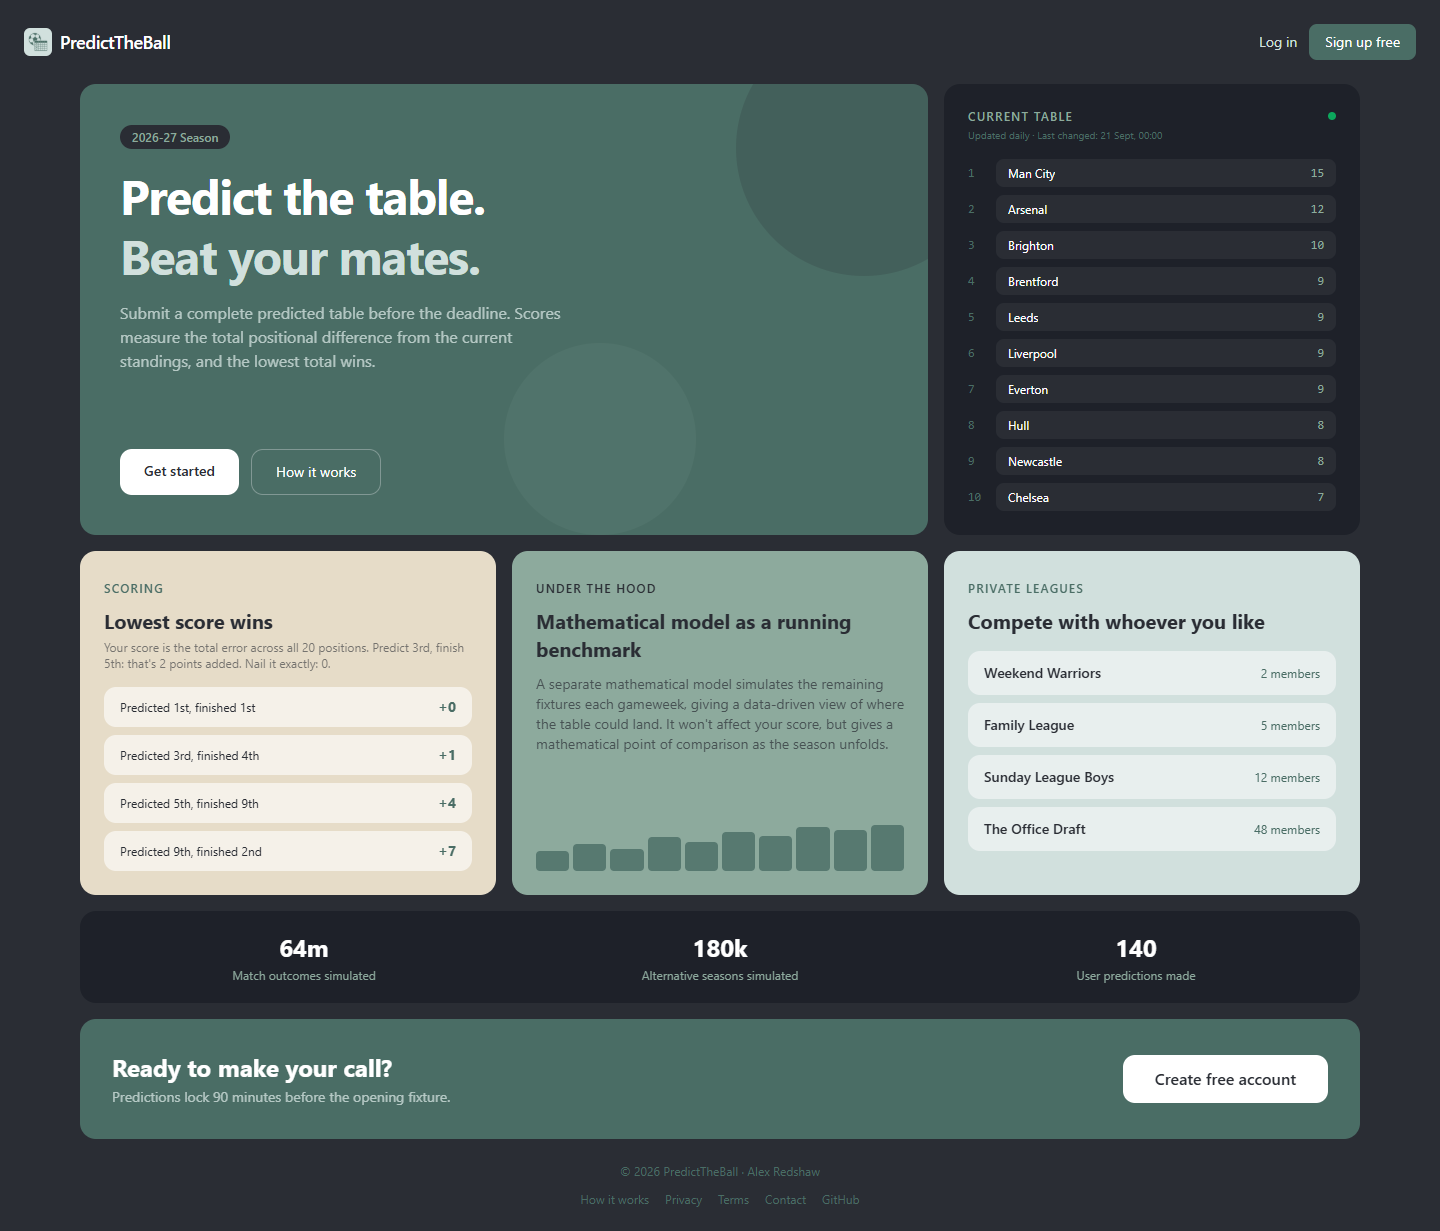
The public landing page. The league names are examples, while the table and simulation totals come from the running service.
Twenty clubs, one prediction
The game starts with a draggable table. Put every club where you think it will finish, save it, and make whatever last-minute changes your transfer-window optimism requires. Predictions lock 90 minutes before the opening fixture.
Your score is the sum of the absolute differences between predicted and actual positions. Lower is better.
score = sum(abs(predicted_position - actual_position))
If you put Liverpool second and they are currently fourth, that adds two points. An exact position adds zero. Getting two neighbouring clubs the wrong way round adds two points overall, because both clubs are one place out. When two players have the same total, the one with more exact positions ranks higher.
During the season, the score is measured against the current table. It settles into a final result once the season ends. An alarming score after three matches is therefore provisional, which is a useful word to remember when discussing your league position.
Each account has one prediction per season. That same table is used in the global rankings and every private league the player joins. League membership is separate from the prediction, so joining another group does not mean filling out another table. Private leagues use invite codes and have their own member leaderboards, with comparisons showing where people's predictions differ.
The deadline is enforced in Flask as well as on the page. Disabling a button would be a fairly optimistic interpretation of security. The API also checks that a submitted table contains exactly the correct clubs, with no duplicates, and keeps other players' predictions hidden until the deadline passes.
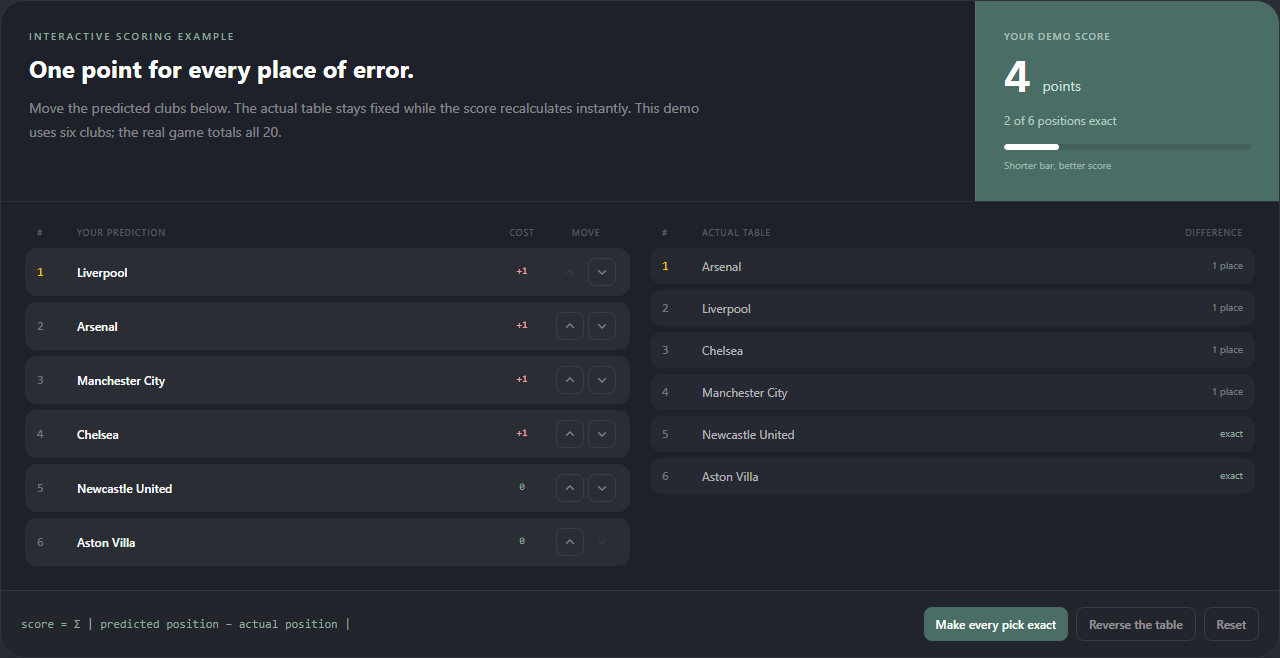
The interactive walkthrough uses six clubs to explain the scoring. Moving a club updates its error and the total immediately. The full game scores all 20.
Giving the computer a go
My xG project estimates shot probabilities, and xLthm forecasts FPL points. Here, the question is where a whole league might finish.
The model starts with historical results from football-data.co.uk, covering the Premier League, Championship, League One and League Two from 2016/17 onwards. Including the lower divisions gives promoted clubs a match history before they arrive in the Premier League. Current-season results and remaining fixtures come from the official FPL API.
Those sources disagree on some club names. A saved mapping brings them into the same vocabulary before the results are combined. Otherwise, a newly abbreviated team name can quietly become a brand-new club with no history, which would be an interesting way to interpret promotion.
Elo assigns each club a rating, starting at 1,500. Before a match, the difference between the two ratings gives an expected result, adjusted for home advantage. Ratings then move according to how surprising the actual result was. A win counts as one, a draw as half and a loss as zero. There is also a margin-of-victory adjustment, so a sufficiently large win moves the ratings more than a narrow one.
Four parameters are tuned with SciPy's differential evolution. They control how quickly ratings change, home advantage, the influence of winning margins and how far ratings move back towards 1,500 between seasons.
The deployed parameter file has a base update factor of 21.20, home advantage of 45.75 rating points and a margin weight of 0.335. The selected off-season reversion is zero. The code supports pulling ratings back towards the average, but the fitted configuration currently carries them over unchanged.
Tuning runs through matches chronologically and measures loss on the latest three seasons. Each match prediction uses the rating state from before its result. Draws receive a target of 0.5 in the loss calculation. Those seasons are used to choose the parameters, so this is development validation. It does not give me an independent test of the final model's performance.
Playing the rest of the season 10,000 times
For each saved forecast, the model rebuilds ratings from the available results and calculates probabilities for the remaining fixtures. The Elo expected result is split into home-win, draw and away-win probabilities. Draw probability is highest for evenly matched sides, at 28%, and falls as the matchup becomes more uneven.
NumPy then samples the remaining season 10,000 times. Every run starts with the real points and goal differences already on the board, including any recorded points deductions. Each sampled result adds three points for a win or one for a draw, with a sampled winning margin updating goal difference. The resulting tables are ranked and counted.
The output is a probability for every club finishing in every position, plus its mean finishing position. Title chances come from the first-place count. Relegation risk is the combined count for 18th, 19th and 20th. A club can be third in the model's ordering while having a mean finish of 4.6, because that mean averages its position across all the simulated tables.
The saved forecast from 21 September 2026 had 330 fixtures left to play. At 10,000 runs, that meant 3.3 million sampled match outcomes for that snapshot. The API serves the saved result, so opening the model page does not ask the server to play another three million matches.
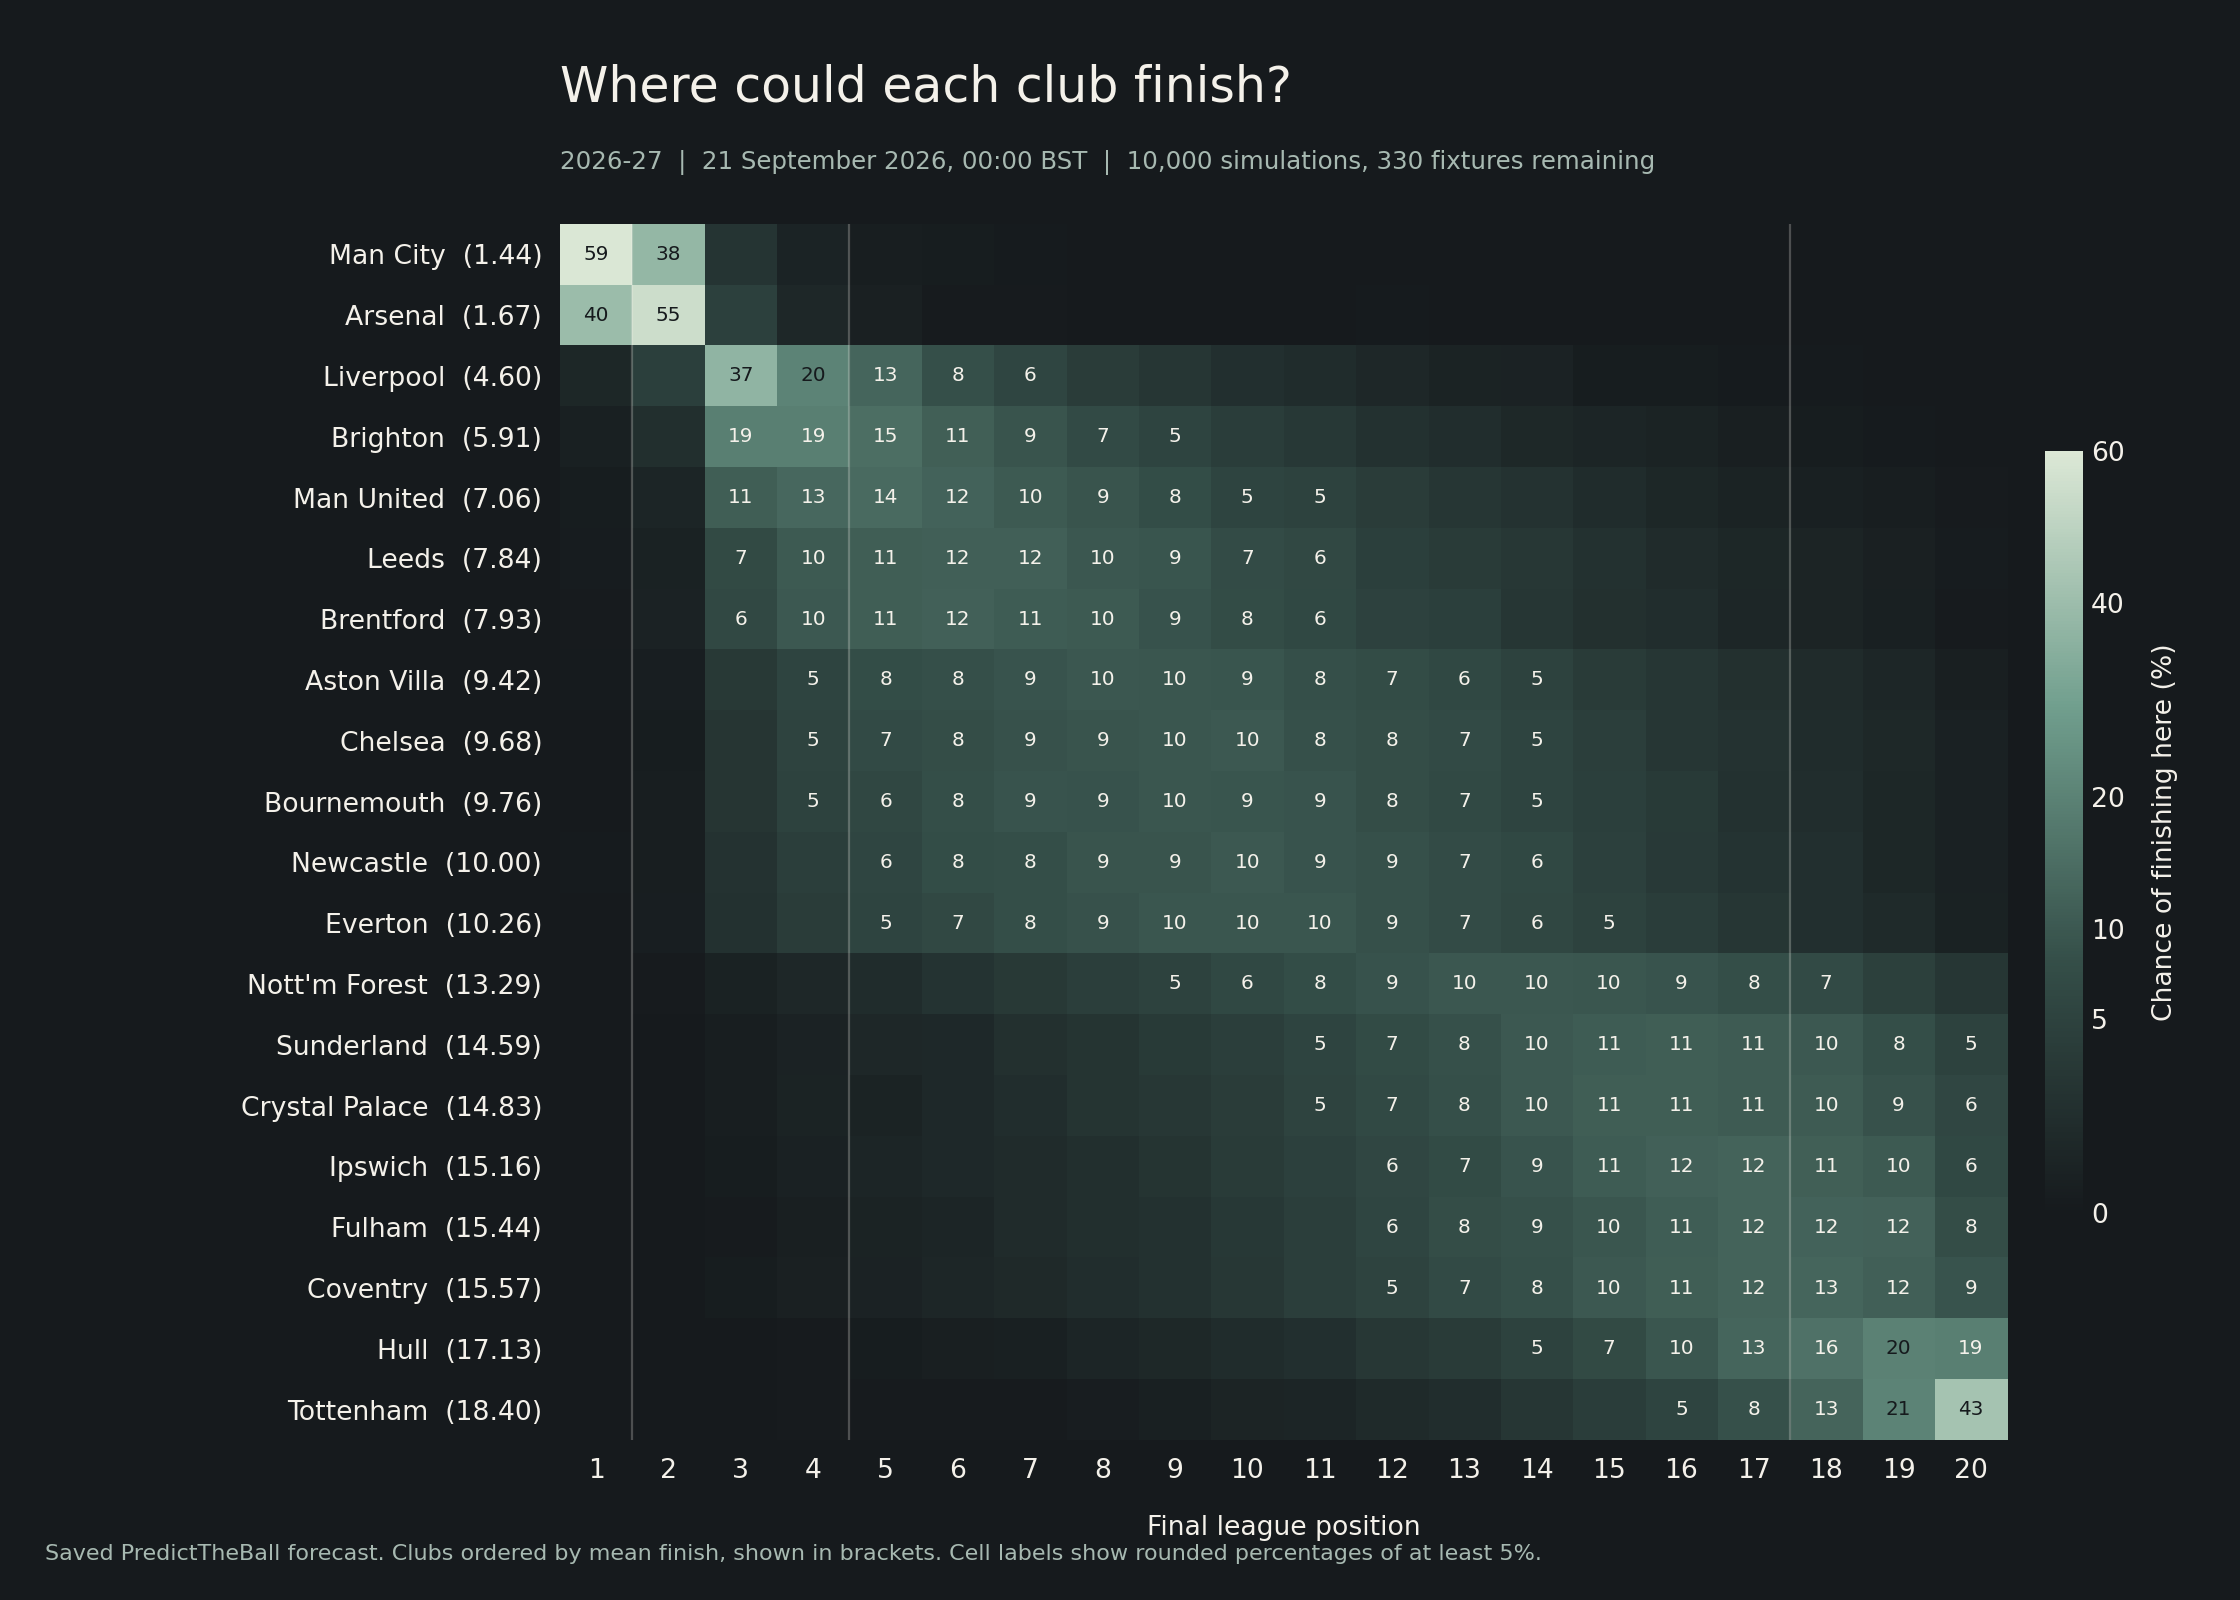
The saved 2026/27 forecast at 00:00 BST on 21 September. Brighter cells mean a higher probability. The figures in brackets are mean finishing positions, and cell labels show rounded percentages of at least 5%.
That snapshot gave Manchester City a 59.25% title chance and Arsenal 39.78%. Liverpool were third in the ordering, with a mean finish of 4.60 and a 62.24% chance of making the top four. Their title chance was 0.65%. As a Liverpool supporter, I have some feedback.
The chart also shows why I wanted to retain the whole distribution. Around the middle of the table, a single predicted position hides a fairly broad range of possible finishes. Sorting clubs by their averages gives a readable table, but the extra probabilities explain how uncertain that order is.
Keeping the original forecast
The website lets players inspect a club's full position breakdown, look up earlier forecast dates and compare the model with the live table. Forecasts are stored as separate snapshots, so an updated prediction does not overwrite what the model thought previously.
For the player-versus-model comparison, the game scores the earliest saved forecast's ordering using the same positional-error rule as a human prediction. Later forecasts can use the results that have arrived since then. Keeping those two uses separate means the benchmark cannot quietly replace its original table after a bad weekend.
The first pre-season snapshot, saved on 24 July, gave Arsenal a 58.14% title chance and City 36.33%. By the September snapshot those probabilities had flipped. Both versions remain in the database, and the July ordering is still the one scored against players.
There are limits to what the probabilities mean. Ratings stay fixed within each simulated season. They update when real results arrive, but a sampled winning streak does not make a club stronger during that run. The model also has no direct knowledge of transfers, injuries or a manager being sacked.
Draw probabilities use a fixed rule, and winning margins come from a simple geometric distribution. Simulated ties use points and goal difference, then a random final separator. The simulation does not reproduce the Premier League's full tiebreak rules. These are practical approximations that need checking against finished seasons before I can make much of the percentages.
Running 10,000 seasons reduces sampling noise. It does very little to help if the assumptions going into them are wrong.
Making it work as a website
The frontend uses React 19, Vite and Tailwind, with dnd kit handling the prediction table. There are pointer and touch controls, plus up and down buttons for moving a club without dragging. The interface tracks unsaved changes and warns before leaving an edited table. It also has an installable web-app manifest, so it can sit on a phone's home screen.
Flask serves the API, with SQLAlchemy and SQLite storing accounts, predictions, league membership and snapshots. Alembic handles schema changes. Passwords are hashed with bcrypt. Authentication uses short-lived JWT access tokens and refresh sessions, with the refresh token held in an HttpOnly cookie. Account verification and password recovery are part of the application too.
The live service runs on my Oracle Cloud Infrastructure VM. Nginx serves the built frontend and proxies the API to Gunicorn in Docker. The backend port is bound to localhost, and the database and modelling files live in mounted directories so they survive container replacements.
GitHub Actions deploys updates from the main branch over SSH. It builds the frontend and backend, applies database migrations and publishes the static files. Data refreshes use a separate container job to fetch results, rebuild the table, recalculate scores and save another model forecast. Existing Elo parameters are reused during those refreshes.
There is also a backup script that uses SQLite's backup command, checks the copy's integrity and sends a compressed copy to remote storage. People's season-long predictions are a fairly poor thing to lose because I wanted to change a button colour.
The next modelling work is a historical evaluation of the finishing-position distributions, including their calibration and how the fixed draw rule behaves. The game is already usable, and the source is on GitHub. Whether it improves anyone's football judgement remains a separate question. It should at least make that judgement easier to quote back to them.