xLthm: FPL Points Projections
An FPL forecasting tool that models player minutes and football events, simulates fixture outcomes, and serves expected points through a cloud-hosted batch API and interactive dashboard.
It turns out predicting last season is quite easy when you let the code read the results.
My Lazy Manager experiments used perfect hindsight to find the best set-and-forget FPL squad. At the end of that write-up, I said I wanted to build something that looked forward. xLthm is that forecasting project, estimating how many Fantasy Premier League points each player will score in upcoming fixtures.
I've wanted to build something like this properly for years. A tool I could keep running, inspect and improve over a season, without having to remember which notebook cell I last ran. It now produces expected points, expected minutes, probabilities and a scoring breakdown, with a dashboard to explore them. You can try the public version here.
My FPL career apparently peaked in 2022/23, and this is definitely quite a lot of Python to write in an attempt to rectify that.
What goes into a forecast
The data comes from Vaastav's FPL archive and the official FPL API. The archive supplies historical player and fixture records. The live API supplies the current player pool, prices, ownership, availability and fixture schedule. The current configuration covers seasons from 2022/23 through 2026/27.
The shared training table has one row per player per fixture. Using fixture rows saves a lot of trouble when a team plays twice in a Gameweek, has a blank, or gets a fixture moved. Gameweek totals are calculated from whichever fixtures FPL assigns to that week.
Player and team form use the previous 3, 5 and 10 fixtures, alongside season-to-date and previous-season history. There is also context for home advantage, rest days, recent usage and fixture congestion. The rolling calculations are shifted before they reach the model. A player's hat-trick cannot help predict that same hat-trick.
The archive needs a little care. Player codes carry identity across seasons, while fixture membership tells me which club a player represented at the time. Defensive-contribution data only starts in 2025/26. Earlier seasons keep those fields missing, with availability flags, rather than quietly deciding that nobody made a tackle before then.
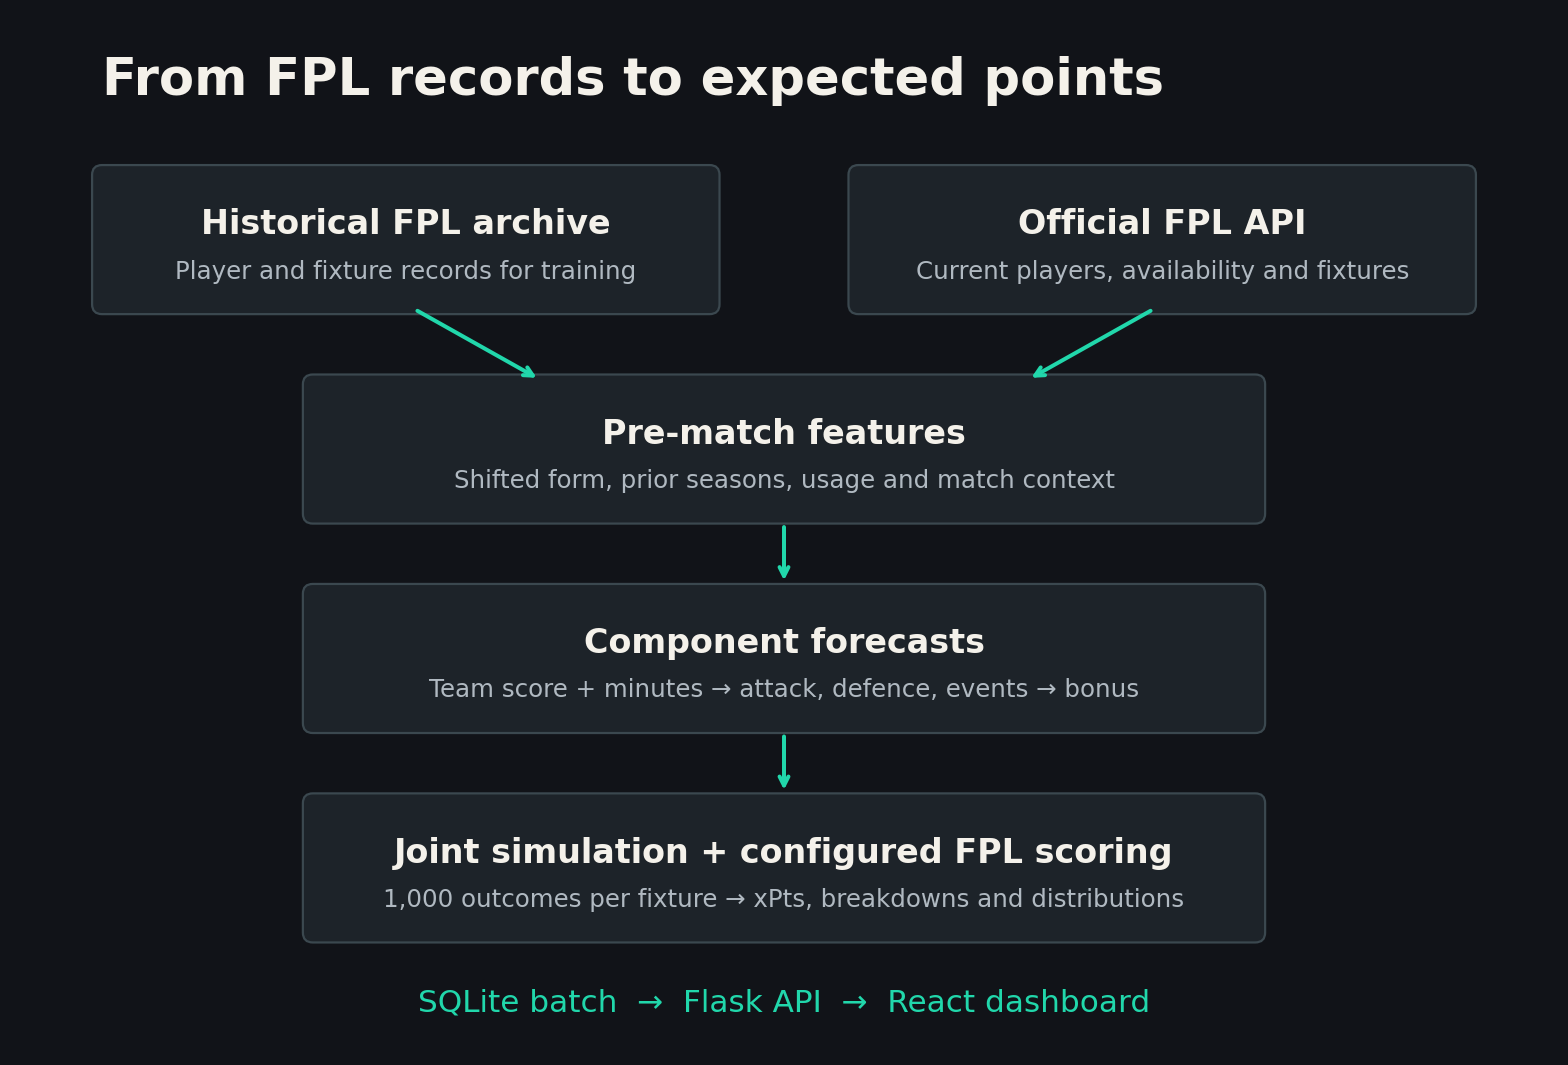
The path from historical FPL records and current fixtures to the forecasts on the website.
Why six models
I wanted to be able to explain a projection. If a defender has 4.5 xPts, how much comes from playing, keeping a clean sheet, attacking returns or defensive contributions? A single model trained on total points would give me less to inspect when the forecast looked wrong.
The system has six component groups. Most learned estimates use scikit-learn's histogram gradient boosting, with different objectives for counts, probabilities and minutes.
The team model estimates goal rates for each side. Those rates form a scoreline probability matrix, with a Dixon-Coles adjustment for low-scoring results. That gives me win, draw and clean-sheet probabilities as well as expected goals.
The minutes model separates non-appearances, starts and substitute appearances, with each playing role split according to whether the player reaches 60 minutes. That gives five possible states, with a predicted duration within each playing state. Two players can have the same expected minutes while having very different chances of reaching 60 minutes, which matters for appearance and clean-sheet points. FPL has given us plenty of reasons to become oddly invested in the timing of a substitution.
The attacking models estimate xG and xA rates per 90, then scale them by forecast minutes. Small samples are pulled towards position-level averages, so one good cameo does not immediately turn a reserve striker into the best forward in the league. Player goal expectations are reconciled with the team forecast. If the team is expected to score 1.5 goals, its players should collectively account for 1.5 goals.
The defensive group covers saves, clean sheets and defensive contributions. Another group handles cards, own goals and penalty misses, using historical priors for the rarer events. The bonus model estimates BPS, adds variation around that estimate, and lets players compete for the available bonus points using the configured tie rules.
Downstream training uses out-of-fold forecasts from the earlier components. Otherwise, the attacking model would learn from unrealistically good team and minutes predictions, then have a rather unpleasant introduction to live use.
Turning football events into FPL points
The component forecasts feed a joint fixture simulation. The current setting runs 1,000 outcomes per fixture. Each run draws a scoreline and player minutes states, allocates goals and assists among players who appear, samples the other events, and applies the scoring rules stored in YAML.
This handles the thresholds in the game directly. A goalkeeper gets save points in groups of three. Defensive-contribution points require reaching a count threshold. Dividing an expected count by the threshold would give the wrong answer, so each sampled outcome is scored before the results are averaged.
The mean is the published xPts. The same samples give the points distribution, percentiles and chances of scoring at least five or ten points. For a double Gameweek, fixture samples are added before the Gameweek distribution is summarised.
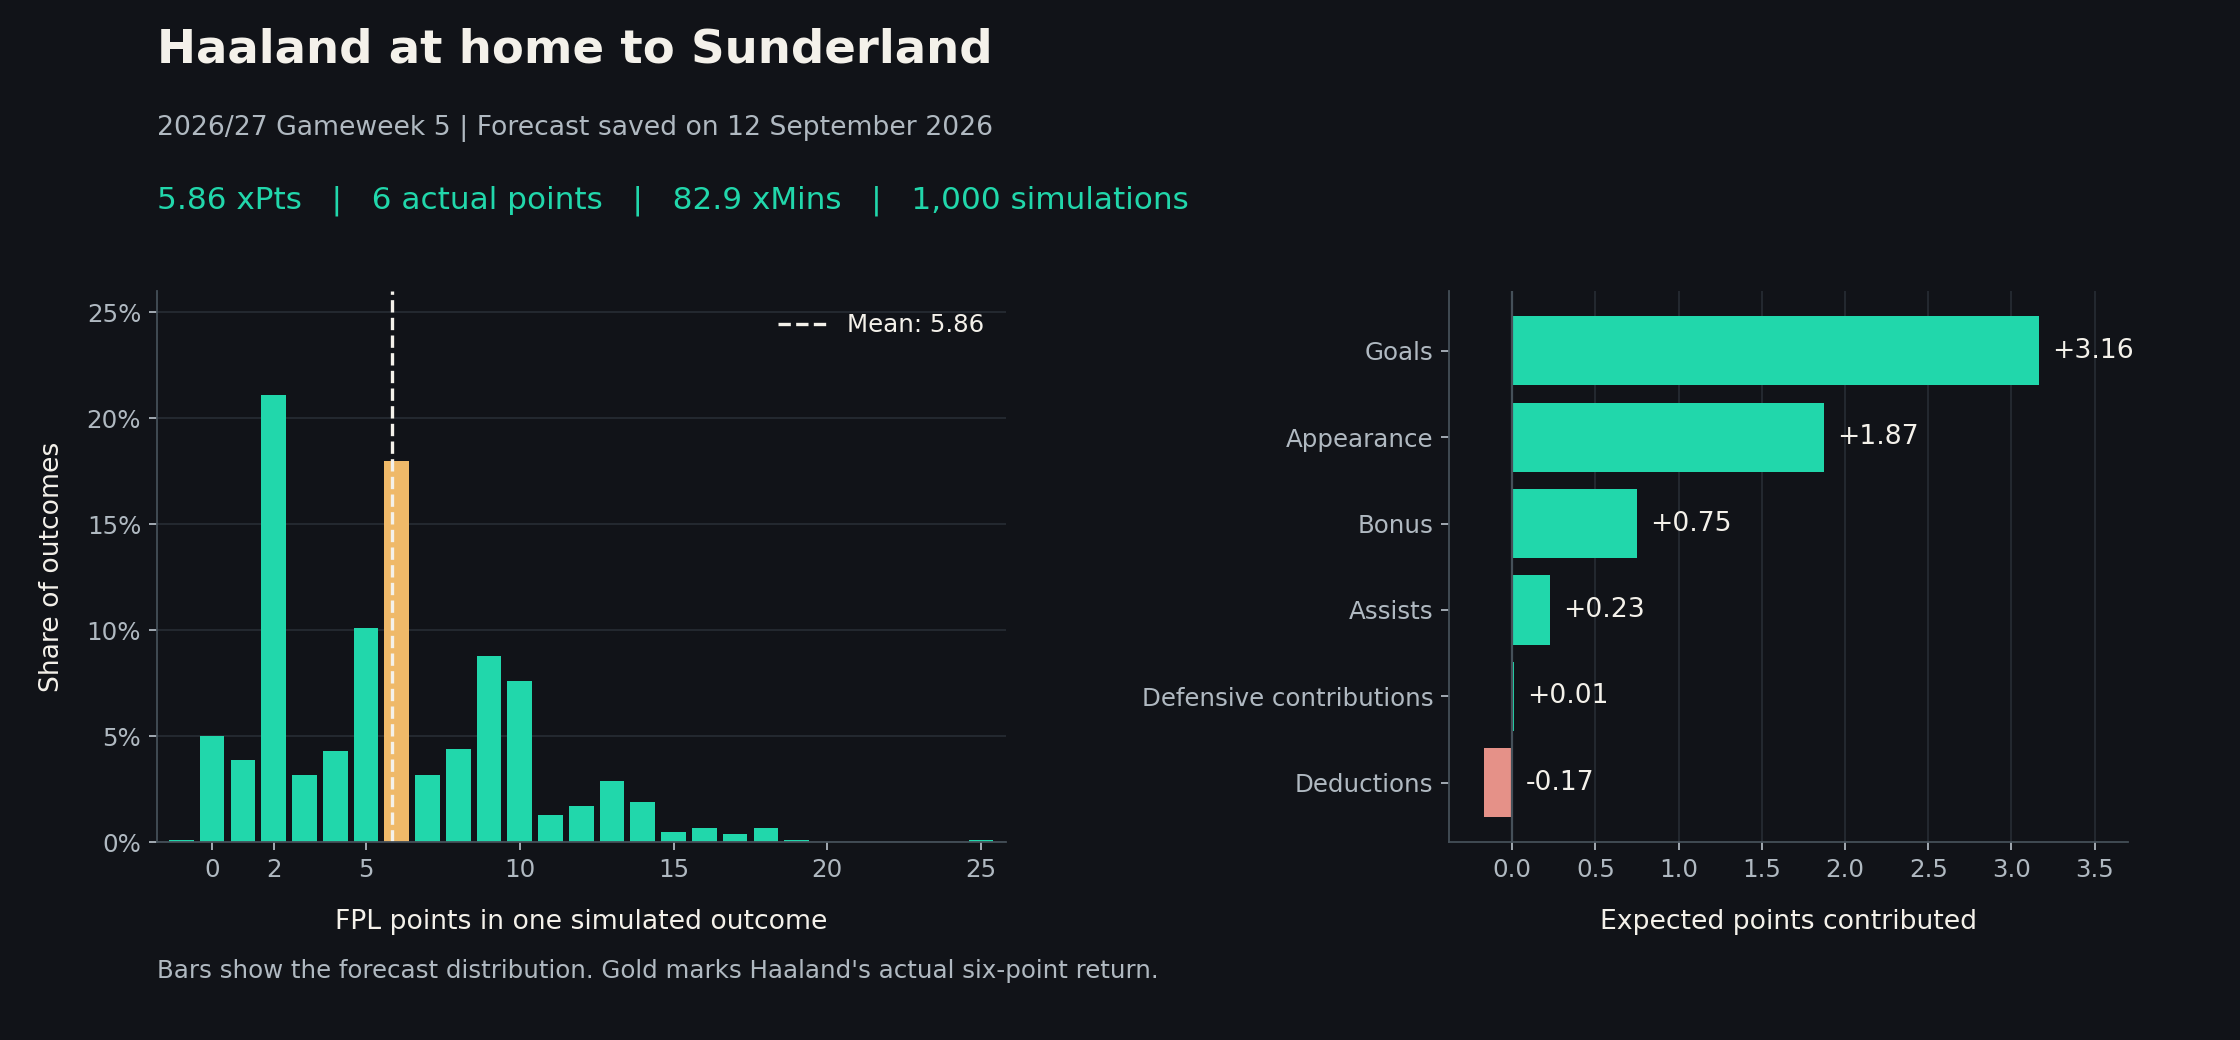
Haaland's forecast for Sunderland at home in Gameweek 5 of 2026/27, made on 12 September. He eventually returned six points.
That example gives Haaland 5.86 xPts. Two points is the most common individual outcome, at 21.1%, while the chance of ten or more is 17.9%. Goals contribute 3.16 expected points, appearance 1.87 and bonus 0.75, with assists and deductions making up most of the rest.
He went on to play 90 minutes and score once in City's 5-3 win, finishing with six FPL points. That's pleasingly close to 5.86, and I will be enjoying it for precisely as long as I can ignore the sample size of one. His goal was worth four points and he earned no assists or bonus, so some component errors cancelled out. Those differences still deserve a look when the headline forecast happens to land close.
The decimal is an average over possible outcomes. Nobody is coming off the pitch with 5.86 points, however strongly the spreadsheet feels about it.
The simulation still makes simplifying assumptions. Minutes are sampled individually, so it does not construct a legal starting eleven for each club. BPS is sampled around a conditional prediction rather than rebuilt from every simulated action. Some relationships are shared through the scoreline and goal allocation, but the model is not a minute-by-minute recreation of a match.
Does it actually work?
Training uses expanding windows. For the main team, minutes and attacking comparisons, each of 2023/24, 2024/25 and 2025/26 is predicted using earlier seasons. Bonus has a shorter validation window, and defensive contributions need chronological blocks within 2025/26 because older data is unavailable.
The saved reports contain these pooled results. The team comparisons cover 1,140 fixtures. The minutes comparison covers 86,755 player-fixture rows, including players who did not appear. Lower is better for every metric shown.
| Measure | xLthm | Simple baseline | Baseline used |
|---|---|---|---|
| Team goals MAE | 0.951 | 1.002 | Historical home/away goal averages |
| Match result log loss | 1.016 | 1.075 | Historical home/away goal averages |
| Team clean-sheet Brier score | 0.174 | 0.179 | Historical home/away goal averages |
| Player minutes MAE | 12.29 | 10.81 | Copy the player's previous fixture minutes |
The last row is annoying. Carrying forward the previous minutes beats the learned model on average absolute error. That is a useful result, and a reason to revisit the duration forecasts. The model also produces appearance and 60-plus probabilities, which need their own evaluation. A single minutes estimate cannot tell me how often a player is likely to miss out entirely.
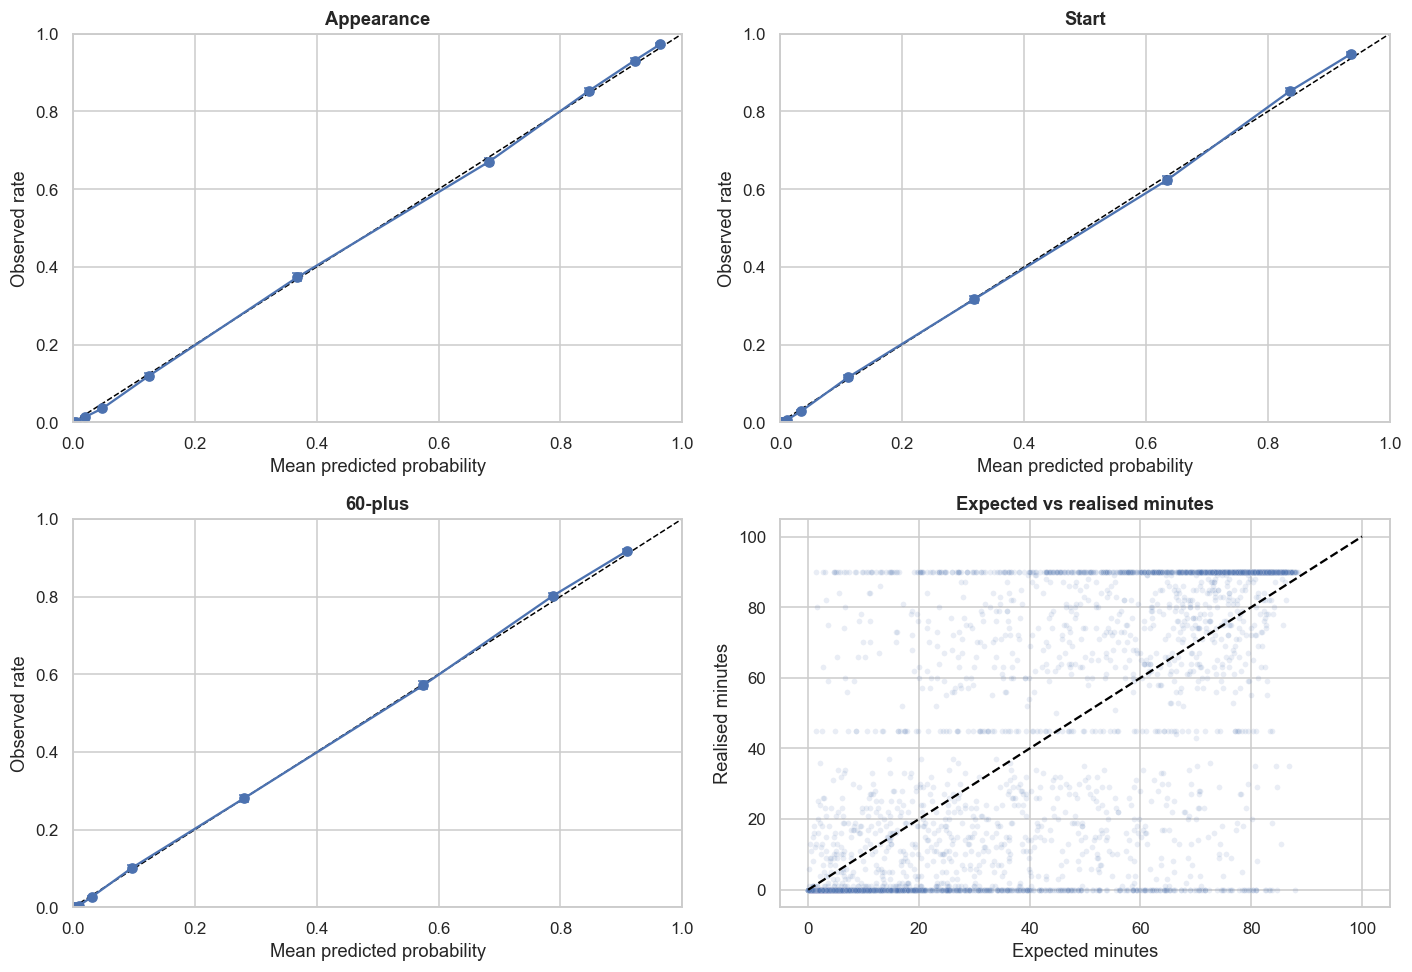
The probability plots compare grouped forecasts with how often players actually appeared, started or reached 60 minutes. The scatter shows the less tidy business of predicting their minutes.
The probability curves are reasonably close to the diagonal in these pooled results. Individual minutes forecasts are much messier. More than half of the validation rows are non-appearances, so an aggregate score also says less about choosing between regular starters than it first appears to.
These are development validation results. The same walk-forward forecasts inform model selection and calibration, so they are not a fresh, untouched test set. They also evaluate components, rather than proving that the final simulated xPts will improve an FPL rank. That needs predictions saved before deadlines and checked against subsequent results.
Making the forecasts usable
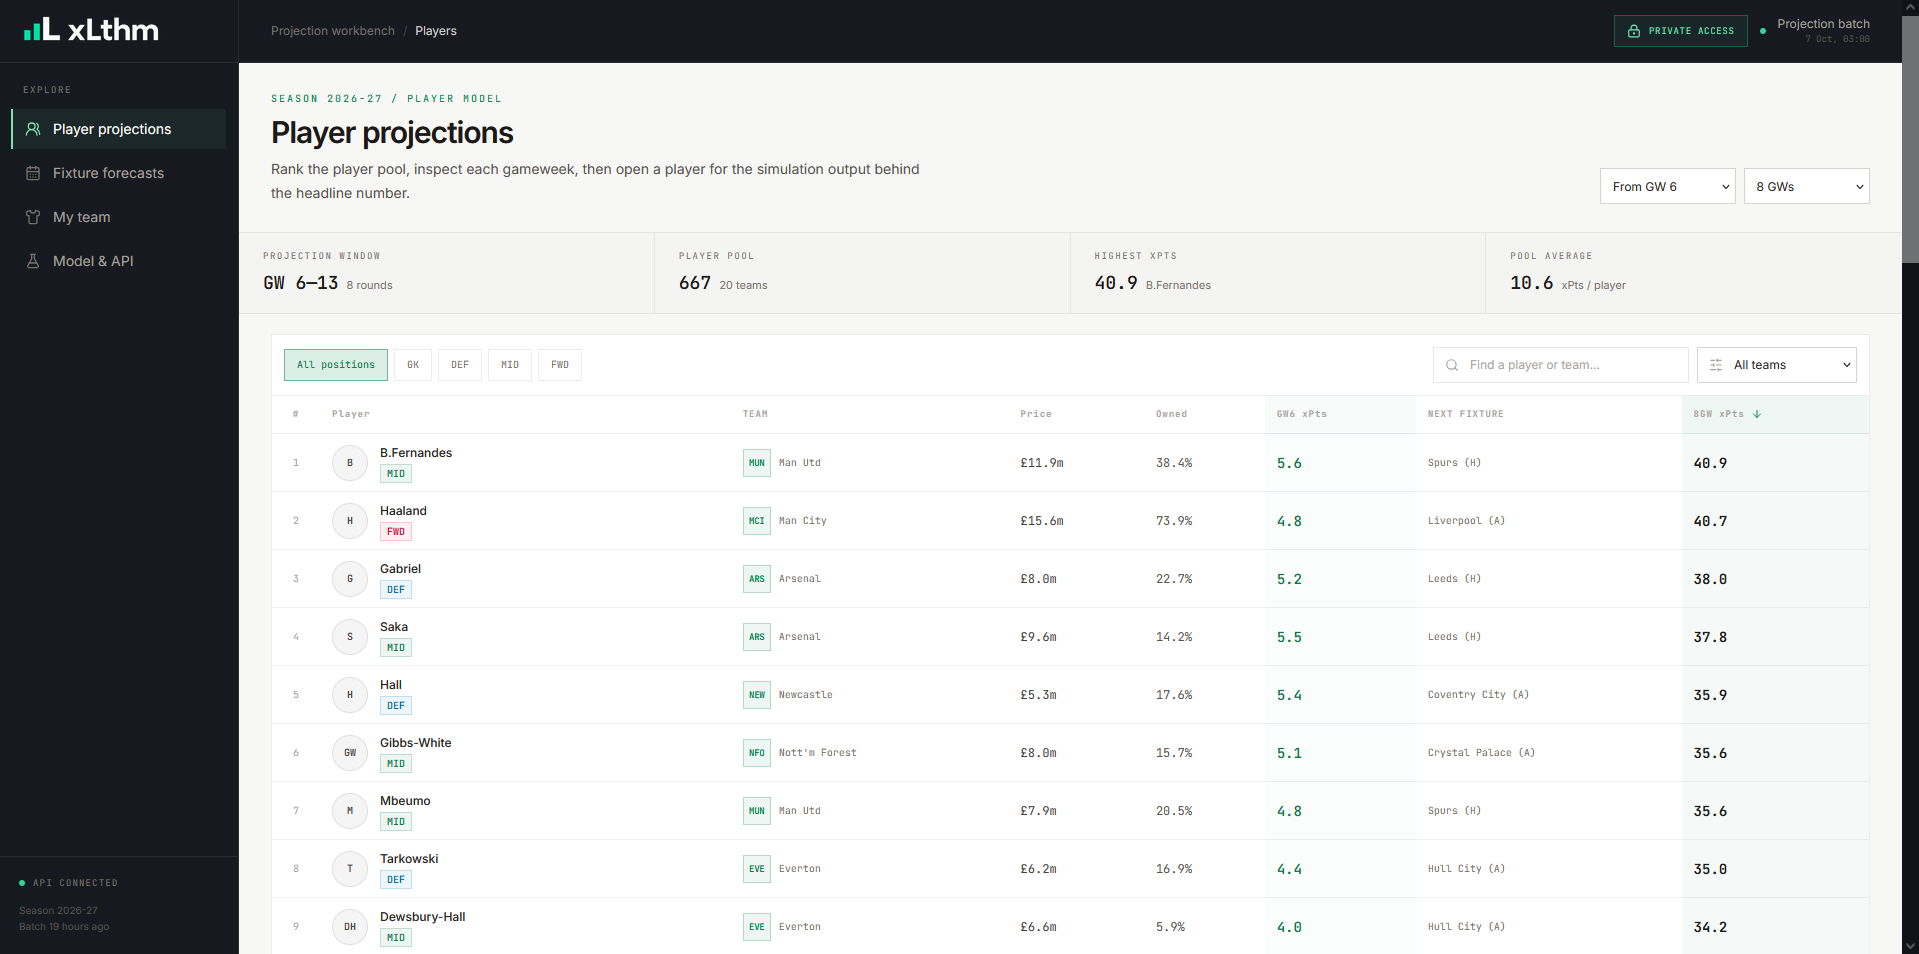
The dashboard uses React, TypeScript and Tailwind. The player view ranks projections over a chosen window and lets you inspect a player's fixtures, scoring contributions and outcome probabilities. The fixture view shows expected goals and result probabilities. The Model & API view exposes batch timestamps, model information and simulation checks, which helps explain whether an odd number comes from the forecast or from stale data.
There is also an FPL squad view. Enter an FPL ID and it loads the latest public squad, compares legal formations, and recommends a starting eleven and captain from the available players. Transfer and chip planning are still on the to-do list.
The public version covers the first three available projected Gameweeks. Authenticated access allows a configurable window across the stored horizon. The private API also exposes the fuller output for analysis outside the website.
I'm keeping the source code private for now, partly to keep the longer-horizon model results from being freely reproduced outside that access arrangement. I may explore sharing the code in future as the project develops. In the meantime, the public site gives people a way to use the 3GW forecasts and see how the model works.
Getting it onto a server
Getting this running as a website was a substantial part of the project. A forecast is considerably more useful when looking it up doesn't involve finding the right Python environment five minutes before the deadline.
It runs on an ARM-based Ubuntu VM in Oracle Cloud Infrastructure. Docker packages the Python backend, with Gunicorn serving Flask from a container that runs as a non-root user. Nginx serves the built React frontend and proxies API requests over HTTPS. The backend is bound to the local interface, with Nginx handling public traffic, request limits and the CORS rules for the frontend. Certbot handles certificate renewal.
GitHub Actions connects to the VM over SSH when the main branch is updated, pulls the code, builds the frontend and backend image, and checks the API is healthy before publishing the frontend assets. Forecast refreshes run separately through a nightly cron job. They use a temporary container with the same backend image, while models and projections persist on the host. Retraining is a separate operation, so changing a button does not become an excuse to refit six models.
A shared lock prevents deployment and model jobs from running over one another. Finished forecasts go into SQLite, which the API reads without having to run the models for each request. A refresh writes a complete replacement database before swapping it into place, and retains the previous batch. Failed retraining restores the previous model set. The API container has a health check and restart policy, and the batch jobs have resource limits so they cannot take over the VM.
Most of this is invisible when the site works. I am quite happy for it to stay that way.
Still building
The immediate work is improving the minutes forecasts and measuring the live predictions as results arrive. Longer-term projections also depend on today's information about injuries and roles, which becomes less useful the further ahead the fixture is. An injury flag is helpful. A manager deciding to rotate everyone after a press conference is less considerate.
I'm proud of finally getting this into a form people can use, after wanting to build it for so long. I'm still actively working on it, with transfer planning, chips and further model evaluation giving me plenty to work on. There appears to be no shortage of ways to spend more time thinking about FPL.
My FPL Challenge project tackles squad selection once projections exist. xLthm builds the forecasts that this sort of optimiser needs, although connecting the projects and handling Challenge's changing rules is separate work.
For now, it gives me a forecast I can inspect before making a decision, then revisit when it goes wrong. It's always good to know whether to blame the minutes estimate, the goal model, or my decision to ignore both.