Algorithm on the Oche: Darts World Matchplay 2024
Let's talk darts. The 31st World Matchplay turned Blackpool's Winter Gardens into an absolute sweatbox last week. Nine days of elite arrows ended with Luke Humphries hoisting his first Matchplay trophy after an 18-15 thriller against Michael van Gerwen. Humphries was basically unplayable. He kicked things off with a massive 108.76 average in round one and casually averaged over 100 against all five of his opponents.
We also saw five new faces on the Blackpool stage. Teenage sensation Luke Littler arrived fresh from beating Humphries in the Premier League Final. He walked in unseeded but was heavily backed by the fans. Sadly for him, Van Gerwen had other ideas and brutally cut his debut short. That win set MVG on a collision course for the final.
Beyond the heavy hitters, the tournament was absolute chaos. Dimitri Van den Bergh sent the crowd wild with the first Matchplay nine-darter in two years. Defending champ Nathan Aspinall struggled with injuries and crashed out in round two against James Wade. Wade barely even qualified for the tournament but somehow rolled back the years to reach the semi-finals. He threw the third-highest average of the whole event before running into the Humphries freight train.
All this got me thinking. Could a machine have predicted any of this?
Before a single dart was thrown, I decided to point my Python skills at the oche. I built an algorithm to predict individual match results and the overall tournament winner. I updated it every single day. Now the tournament is over, let's see if my code is any good at predicting the future.
The Algorithm
I wrote the model in Python using pandas, numpy and scikit-learn. These libraries are great for crunching stats and building fast data pipelines.
Instead of a standard machine learning setup, I went with a hybrid approach. I combined an ELO ranking system with random forest models. ELO is great at tracking long-term competitive form. The machine learning side tries to pick up the smaller statistical quirks.
To make the ELO system fair, I gave it a half-life. Recent matches matter more. A player's rating boost from a specific match halves every 365 days. A massive win from two years ago only counts for a quarter of what a win today does. This keeps the model fresh but it also meant I had to recalculate ELO ratings from the ground up for every single update. I fed it around 76,000 matches dating all the way back to 1994. My poor laptop definitely felt the burn.
When two players meet, the algorithm compares their ELO ratings to spit out an expected result. If the underdog wins, they steal a massive chunk of ELO points. If the favourite wins as expected, their rating barely moves.
def update_overall_elo(match_result, home_elo, away_elo, k=32, scaling_factor=400):
    """
    Update the ELO ratings of two players based on a match result.

    Args:
        match_result (dict): A dictionary containing information about the match result.
        home_elo (float): The ELO rating of the home team.
        away_elo (float): The ELO rating of the away team.
        k (float, optional): The scaling factor for the ELO rating. Defaults to 32.
        scaling_factor (float, optional): The scaling factor for the ELO rating. Defaults to 400.
    """
    # Get the current date using time as YYYY-MM-DD
    current_date = time.strftime("%Y-%m-%d", time.localtime())
    day_difference = (pd.Timestamp(current_date) - pd.Timestamp(match_result['date'])).days
    recency_weight = 0.5 ** (day_difference / 365)
    adjusted_k = k * recency_weight

    # Calculate the expected score for each team
    home_expected = 1 / (1 + 10 ** ((away_elo - home_elo) / scaling_factor))
    away_expected = 1 / (1 + 10 ** ((home_elo - away_elo) / scaling_factor))

    # Calculate the actual score (1 for win, 0 for loss)
    home_actual = 1 if match_result['home_team_legs_won'] > match_result['away_team_legs_won'] else 0
    away_actual = 1 - home_actual

    # Update the ELO ratings
    home_elo_new = home_elo + adjusted_k * (home_actual - home_expected)
    away_elo_new = away_elo + adjusted_k * (away_actual - away_expected)

    return home_elo_new, away_elo_new
(Above) A function that uses previous ELOs and actual match outcomes to adjust ratings.
# The completion of this process assumes
# A darts_matches dataframe containing information about darts games and their results
# A players_elo dictionary containing the current ELO ratings of each player

# For each result (row) in the df...
for index, match in darts_matches.iterrows():
    home_elo = players_elo[match['home_team']]
    away_elo = players_elo[match['away_team']]

    # Sets the ELO to the current ELO value in the players_elo dictionary.
    darts_matches.loc[index, 'home_team_elo'] = home_elo
    darts_matches.loc[index, 'away_team_elo'] = away_elo

    # Prepares a basic match result dictionary for use by the function.
    match_result = {
        'home_team_legs_won': match['home_score'],
        'away_team_legs_won': match['away_score'],
        'date' : match['date']
    }

    # This is the point where the function in the previous code block is called.
    home_elo, away_elo = update_overall_elo(match_result, home_elo, away_elo)

    # ELOs are updated in the darts_matches dataframe with the new ELOs
    darts_matches.loc[index, 'home_team_elo'] = home_elo
    darts_matches.loc[index, 'away_team_elo'] = away_elo

    # The new ELO ratings are also updated in the players_elo dictionary to be used for players' next games.
    players_elo[match['home_team']] = home_elo
    players_elo[match['away_team']] = away_elo

# Display the up to date ELO rankings
print('ELO Rankings:')
display(pd.DataFrame.from_dict(players_elo, orient='index', columns=['Elo']).sort_values(by='Elo', ascending=False))
(Above) Calling the ELO function and updating the relevant values for each match.
Once I had the ratings, I mapped out the entire tournament bracket. The model calculated win probabilities for every possible match-up. I actually found that the ELO ratings were far better at predicting winners than the random forest stats model.
To see how the whole tournament might unfold, I simulated the entire bracket 100,000 times. I used a random number generator weighted by the ELO win probabilities. This method accounts for all the weird and wonderful paths a player might take to the final.
By tracking how far each player made it across those 100,000 runs, the algorithm gave me a clean percentage chance of anyone reaching the last 32, quarter-finals or beyond.
Since the real Python code for this is a bit of a maze, here is a simplified pseudocode version to show how the simulation hangs together.
# SIMPLIFIED PSEUDOCODE IMPLEMENTATION
# The following function implementations are not shown
# simulate_game(home_player, away_player) - Returns the simulated winner
# update_tournament_bracket(winner, home_player, away_player) - Updates bracket
# update_player_results(player_results_df, single_tournament_result) - Increments values

# A pandas dataframe stores the number of times a player reaches each round
player_results_df = pd.Dataframe()

def simulate_tournament(tournament_bracket_info):
    """
    Simulates a single tournament
    """
    # For all rounds
    for round in tournament_bracket_info:
        # For all games in a round
        for game in round:
            # Use the ELOs to simulate the winner of a game
            winner = simulate_game(home_player, away_player)
            # Update the tournament info for further down the bracket
            tournament_bracket_info = update_tournament_bracket(winner, home_player, away_player)

    # Return the completed bracket
    return tournament_bracket_info

# Directed graph structure used to highlight the relationship of matches
tournament_bracket_info = [{...}, {...}, ...]

# Updates the player_results_df for each of the 100,000 simulations
for i in range(100000):
    single_tournament_result = simulate_tournament(tournament_bracket_info)
    update_player_results(player_results_df, single_tournament_result)
(Above) The pseudocode for the tournament simulation process.
Match-by-Match Results
Let's look at what the model actually predicted. Below is a round-by-round breakdown of the tournament highlighting the pre-match win probability for every single game.
Last 32
July 13, 2024
| Player | Win Probability | Score | Win Probability | Player |
|---|---|---|---|---|
| Gerwyn Price | 57.2% | 10-4 | 42.8% | Daryl Gurney |
| Jonny Clayton | 65.9% | 10-7 | 34.1% | Raymond van Barneveld |
| Luke Humphries | 83.1% | 10-4 | 16.9% | Ricardo Pietreczko |
| Nathan Aspinall | 58.2% | 10-8 | 41.8% | Luke Woodhouse |
July 14, 2024
| Player | Win Probability | Score | Win Probability | Player |
|---|---|---|---|---|
| Ross Smith | 64.2% | 10-4 | 35.8% | Josh Rock |
| Danny Noppert | 59.5% | 5-10 | 40.5% | James Wade |
| D. Van den Bergh | 41.0% | 10-6 | 59.0% | Martin Schindler |
| Stephen Bunting | 48.5% | 12-10 | 51.5% | Ryan Joyce |
| Rob Cross | 68.0% | 13-12 | 32.0% | Gian van Veen |
| Joe Cullen | 32.3% | 10-4 | 67.7% | Brendan Dolan |
| Peter Wright | 47.6% | 5-10 | 52.4% | Andrew Gilding |
| Dave Chisnall | 65.9% | 2-10 | 34.1% | Krzysztof Ratajski |
July 15, 2024
| Player | Win Probability | Score | Win Probability | Player |
|---|---|---|---|---|
| Damon Heta | 51.8% | 4-10 | 48.2% | Ryan Searle |
| Michael Smith | 48.8% | 10-5 | 51.2% | Gary Anderson |
| Michael van Gerwen | 34.4% | 10-6 | 65.6% | Luke Littler |
| Chris Dobey | 52.4% | 10-7 | 47.6% | Ritchie Edhouse |
Last 16
July 16, 2024
| Player | Win Probability | Score | Win Probability | Player |
|---|---|---|---|---|
| Gerwyn Price | 41.1% | 9-11 | 58.9% | Ross Smith |
| Nathan Aspinall | 54.4% | 8-11 | 45.6% | James Wade |
| Luke Humphries | 64.4% | 11-7 | 35.6% | Stephen Bunting |
| Jonny Clayton | 71.4% | 5-11 | 28.6% | D. Van den Bergh |
July 17, 2024
| Player | Win Probability | Score | Win Probability | Player |
|---|---|---|---|---|
| Krzysztof Ratajski | 50.8% | 5-11 | 49.2% | Andrew Gilding |
| Rob Cross | 66.4% | 11-6 | 33.6% | Ryan Searle |
| Michael van Gerwen | 79.9% | 11-8 | 20.1% | Joe Cullen |
| Michael Smith | 62.8% | 11-9 | 37.2% | Chris Dobey |
Quarter Finals
July 18, 2024
| Player | Win Probability | Score | Win Probability | Player |
|---|---|---|---|---|
| Ross Smith | 68.7% | 10-16 | 31.3% | James Wade |
| Luke Humphries | 70.3% | 16-10 | 29.7% | D. Van den Bergh |
July 19, 2024
| Player | Win Probability | Score | Win Probability | Player |
|---|---|---|---|---|
| Michael van Gerwen | 68.6% | 16-10 | 31.4% | Andrew Gilding |
| Michael Smith | 41.1% | 16-7 | 58.9% | Rob Cross |
Semi Finals
July 20, 2024
| Player | Win Probability | Score | Win Probability | Player |
|---|---|---|---|---|
| Luke Humphries | 68.5% | 17-10 | 31.5% | James Wade |
| Michael van Gerwen | 45.9% | 17-13 | 54.1% | Michael Smith |
Final
July 21, 2024
| Player | Win Probability | Score | Win Probability | Player |
|---|---|---|---|---|
| Luke Humphries | 56.9% | 18-15 | 43.1% | Michael van Gerwen |
Model Evaluation
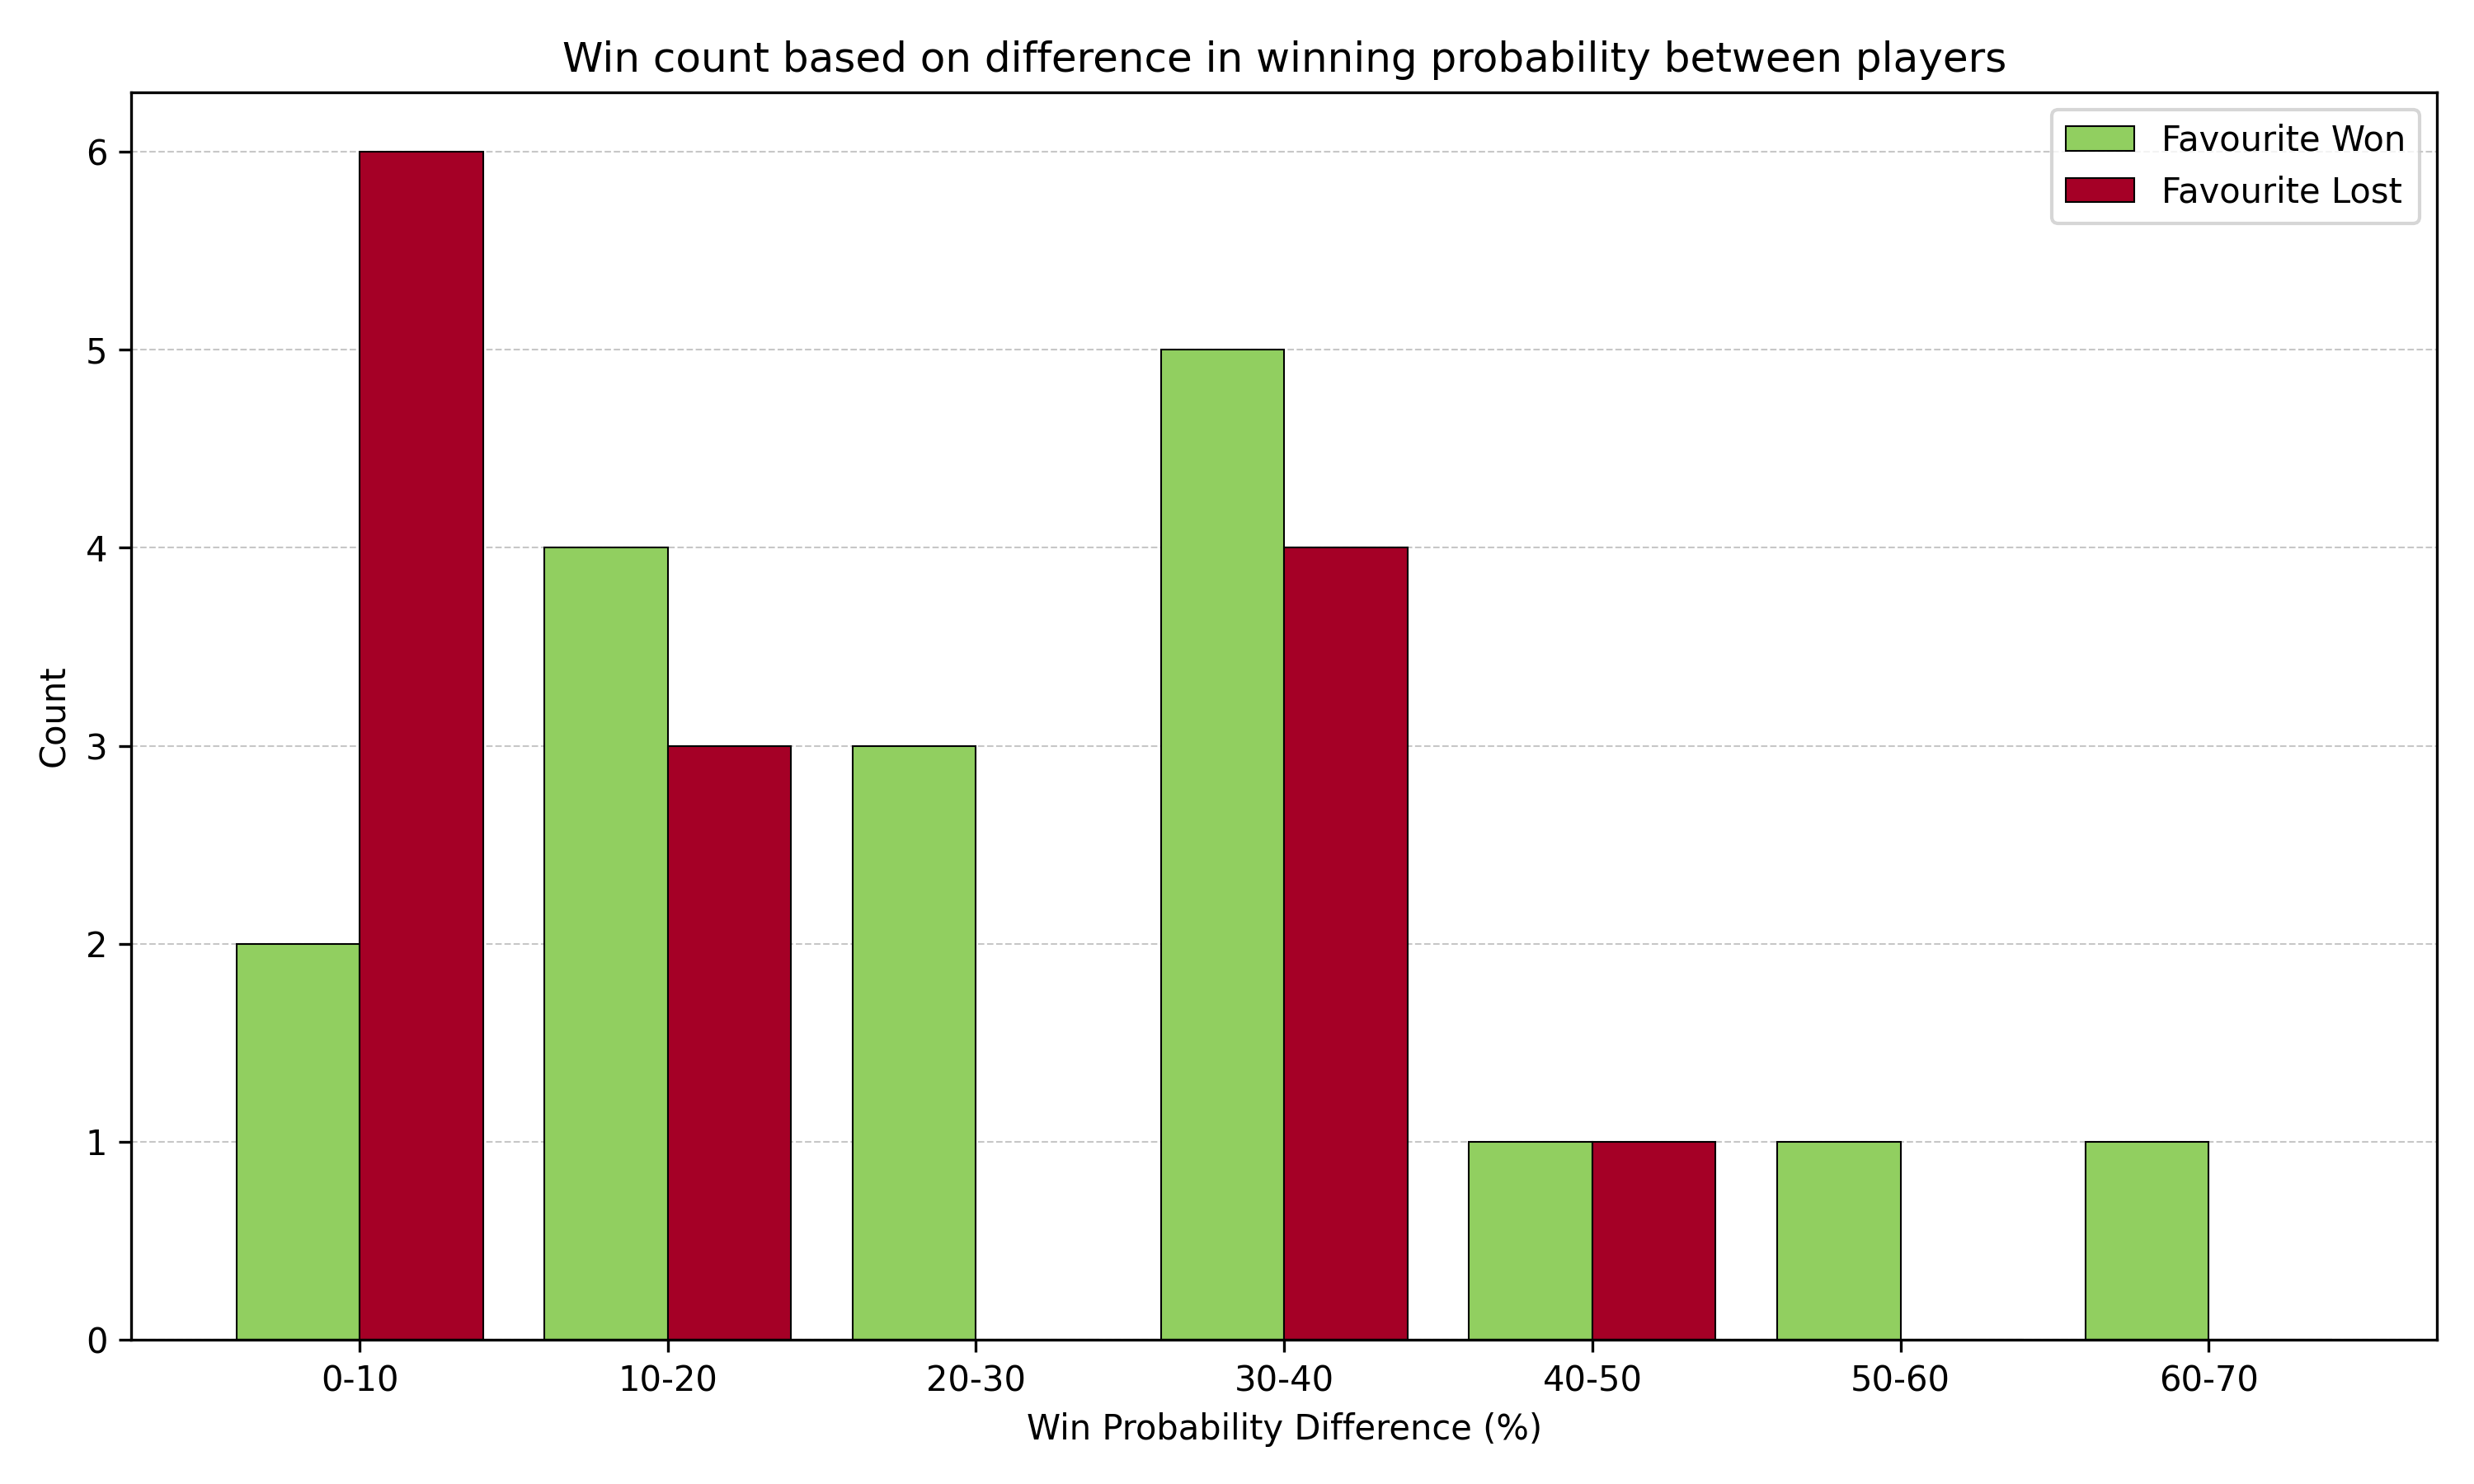
Figure 1: Differences in success rates based on how heavily the model backed the favourite.
Let's look at how the model actually performed. Figure 1 shows the difference in success rates based on how big of an advantage the algorithm gave to the favourite.
As you might expect, the algorithm gets much more accurate when it spots a massive gap in quality. When the model gave one player a probability advantage of more than 10%, it guessed the winner correctly 65% of the time. In these wider brackets the favourite never ended up with a losing record. This makes total sense. Better players usually grind down their opponents in the longer Matchplay format.
Things get a bit messy in the 0 to 10% range. In these incredibly tight matches the algorithm actually underestimated the underdogs. The lesser-favoured players won more often than the favourites. This probably just comes down to the chaos of live darts. You cannot easily code a player losing their nerve, a rowdy crowd, or someone waking up on the wrong side of the bed. We are also looking at a tiny sample size here so it might just be standard tournament variance.
It is also worth noting just how many matches sit in the 0 to 40% probability difference range. Elite darts is incredibly competitive right now. There are very few guaranteed blowouts anymore.
Looking at the tournament as a whole, the model picked Luke Littler and Luke Humphries as the two most likely winners from day one. That was a pretty solid read on the form book.
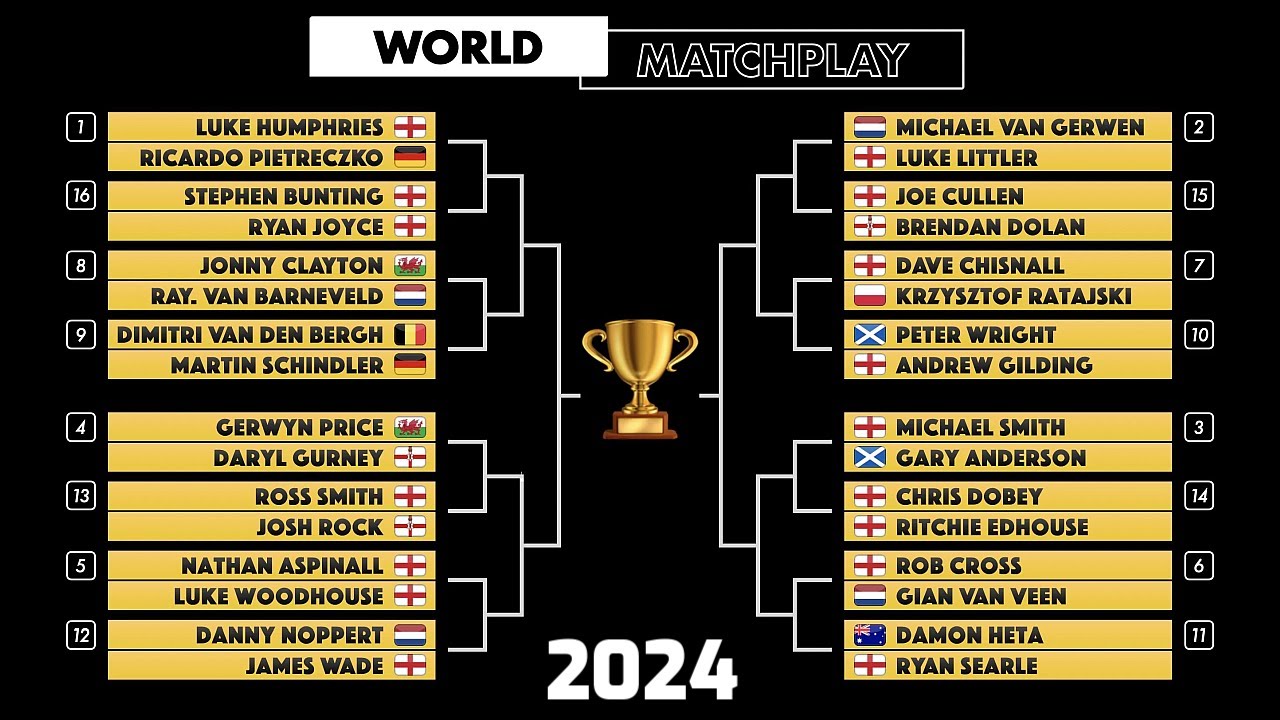
Figure 2: The tournament draw bracket for the 2024 World Matchplay.
While Littler crashed out immediately, his conqueror Michael Van Gerwen rode that momentum all the way to the final. Once MVG knocked out the teenage favourite, his own chances of winning the whole thing skyrocketed from 3.6% to 12.6%. The model recognised that his side of the draw had suddenly opened up. Humphries had a similar probability of lifting the trophy at that stage, mostly because his route to the final looked much harder on paper. Figure 3 tracks how the win probabilities for both finalists shifted as the days went by.
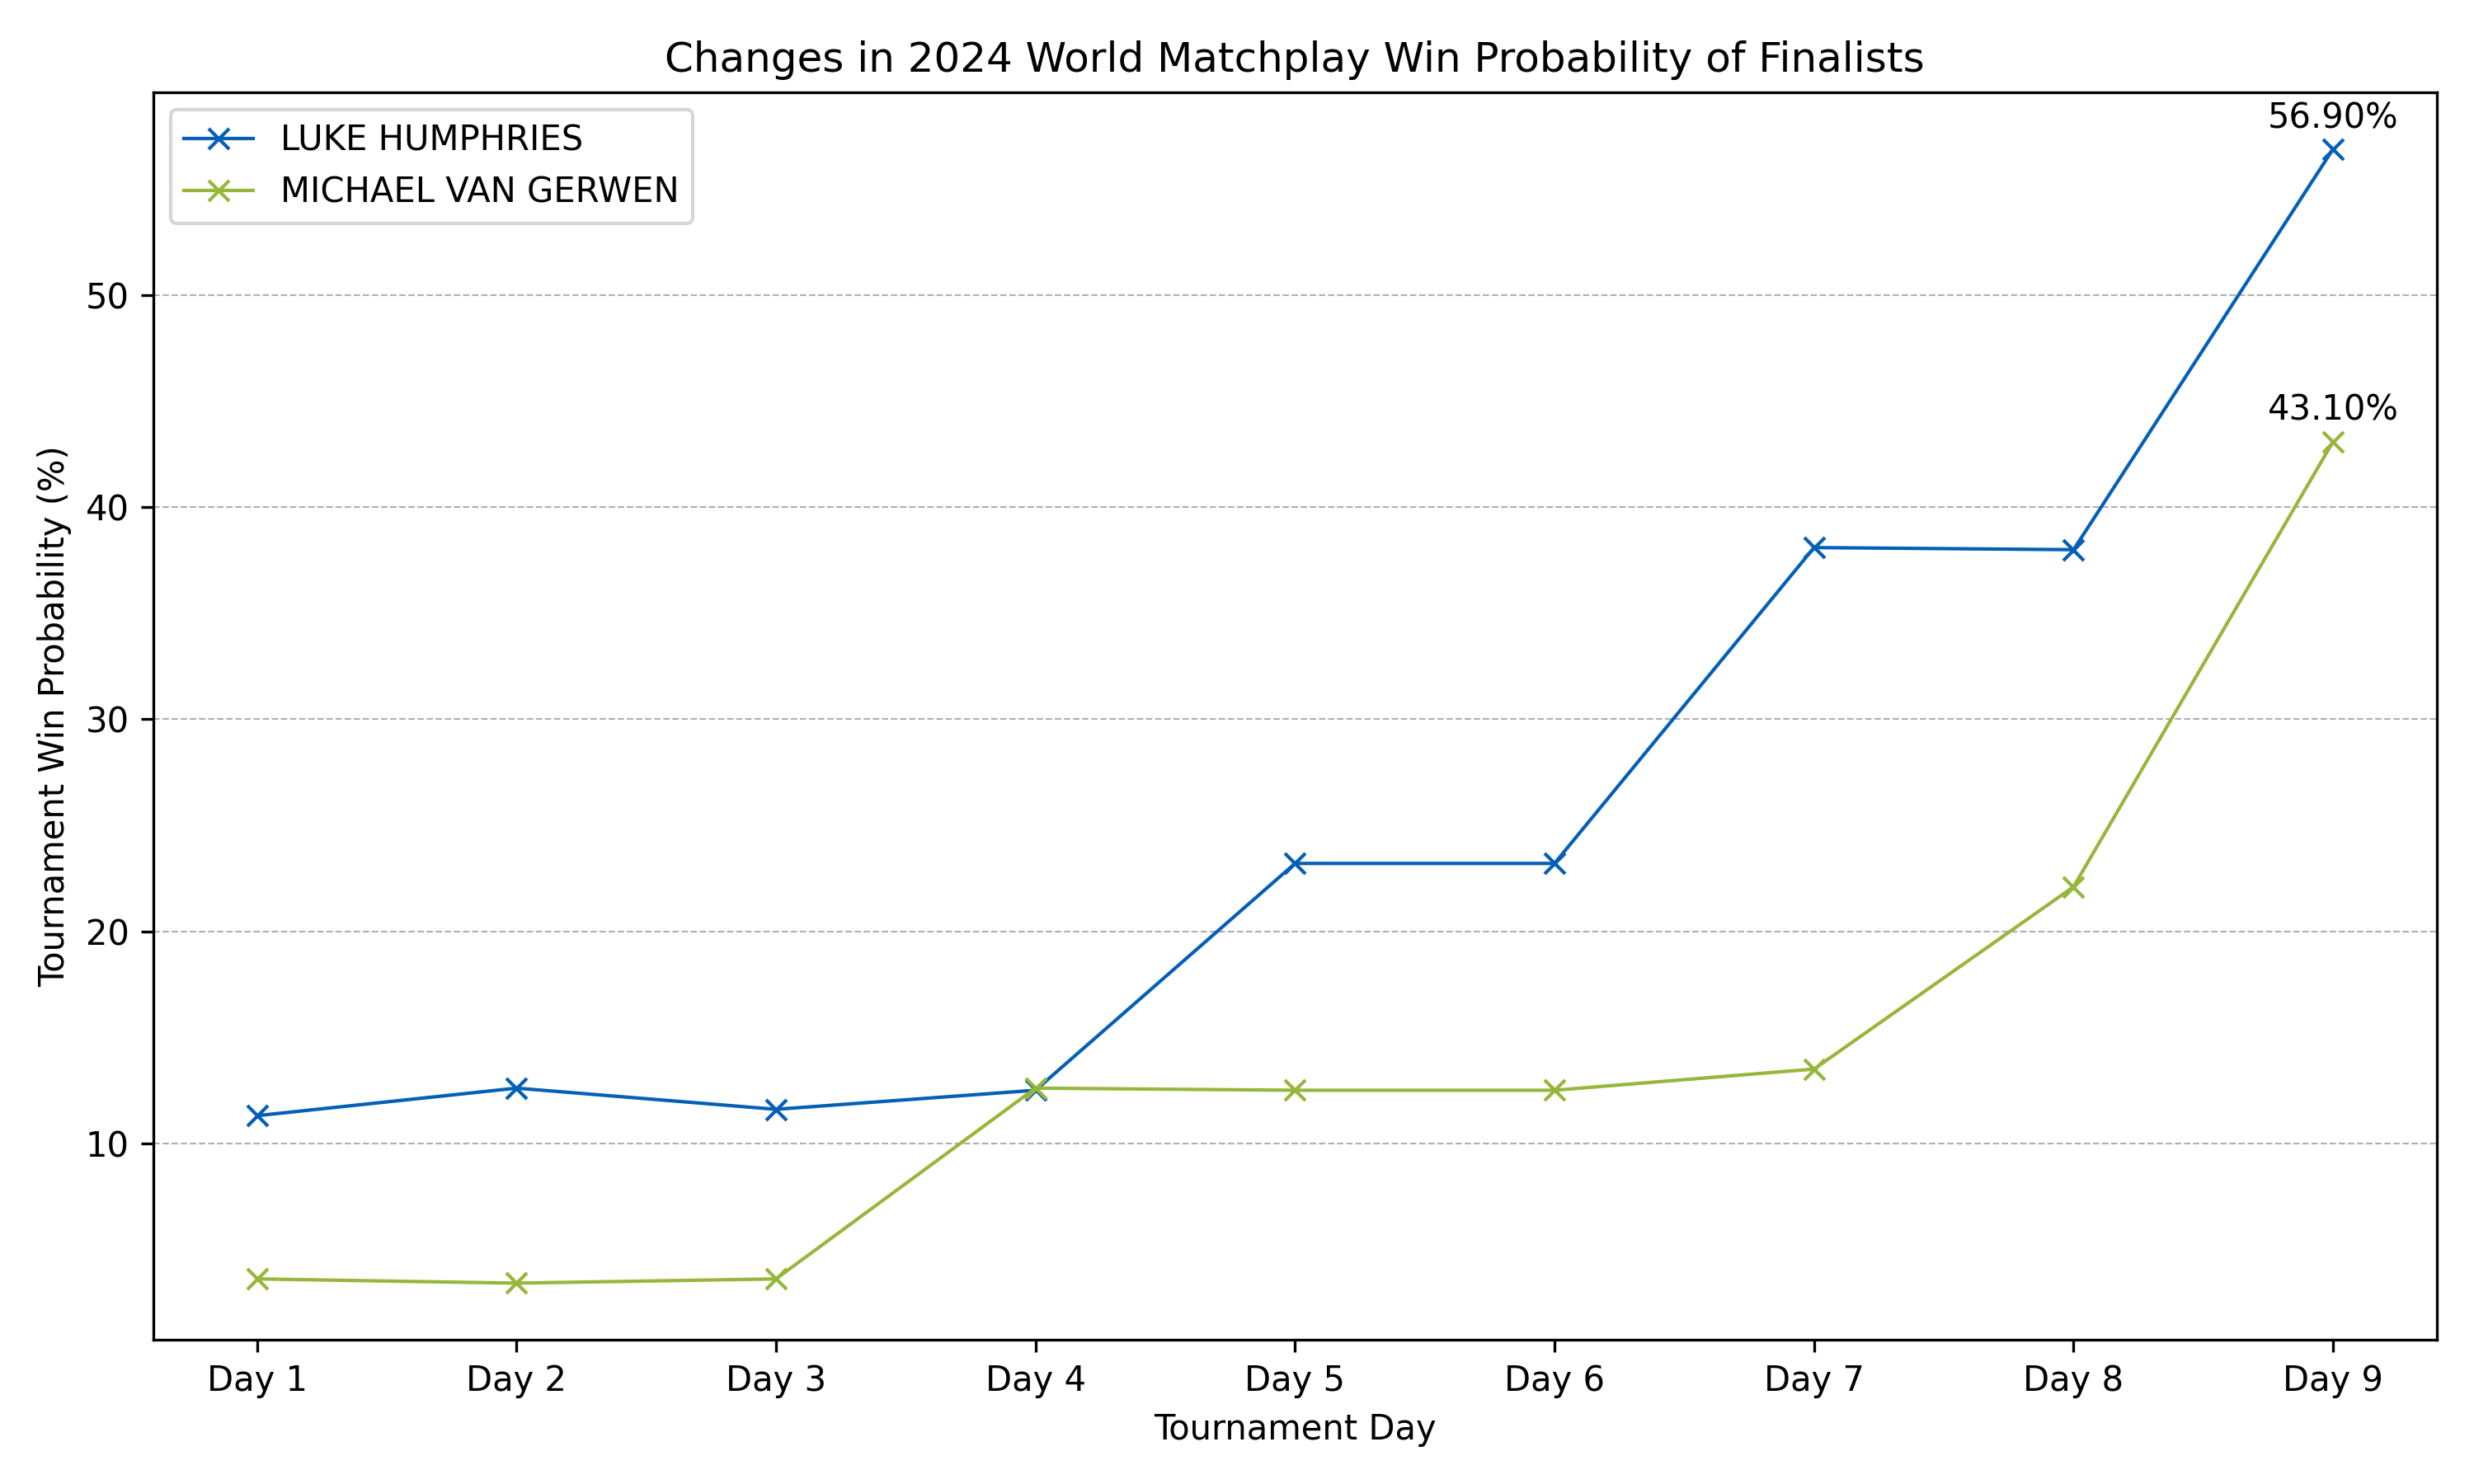
Figure 3: Win probabilities of Luke Humphries and Michael Van Gerwen across the tournament.
At the end of the day, variance is king. The model is just trying to put a number on that chaos. You will never perfectly predict a darts tournament and frankly it would be incredibly boring if you could. I am curious to see if the model's blind spot for tight matches is a permanent flaw or just a quirk of this specific week in Blackpool.
Applied Modelling Approach to PDC Predictor
I didn't just stop at predicting the match winners. I tweaked the algorithm to forecast high checkouts, total 180s and highest averages. I used these stats to play along with the official PDC predictor game.
Here is how my code stacked up against human darts fans around the world.
| Session | Number of Entrants | My Finishing Position | Top x% |
|---|---|---|---|
| Evening Session (13th July) | 2618 | 341 | 13.02% |
| Afternoon Session (14th July) | 2130 | 48 | 2.25% |
| Evening Session (14th July) | 2040 | 530 | 26.00% |
| Evening Session (15th July) | 2068 | 1 | 0.04% |
| Second Round A | 891 | 730 | 82.00% |
| Second Round B | 846 | 522 | 61.70% |
| Quarter Finals A | 776 | 114 | 14.70% |
| Quarter Finals B | 617 | 322 | 52.90% |
| Semi-Finals | 608 | 45 | 7.40% |
| Final | 569 | 171 | 30.10% |
The results were honestly brilliant. The model placed me in the top 29% of players in almost every single round. My median finishing position was in the top 20.35%. I even managed to finish completely top of the global leaderboard on the evening of July 15th. It is a shame there is no overall global leaderboard for the whole tournament, but looking at these round-by-round ranks, I am pretty confident the algorithm battered most of the human competition.
Overall Tournament Analysis
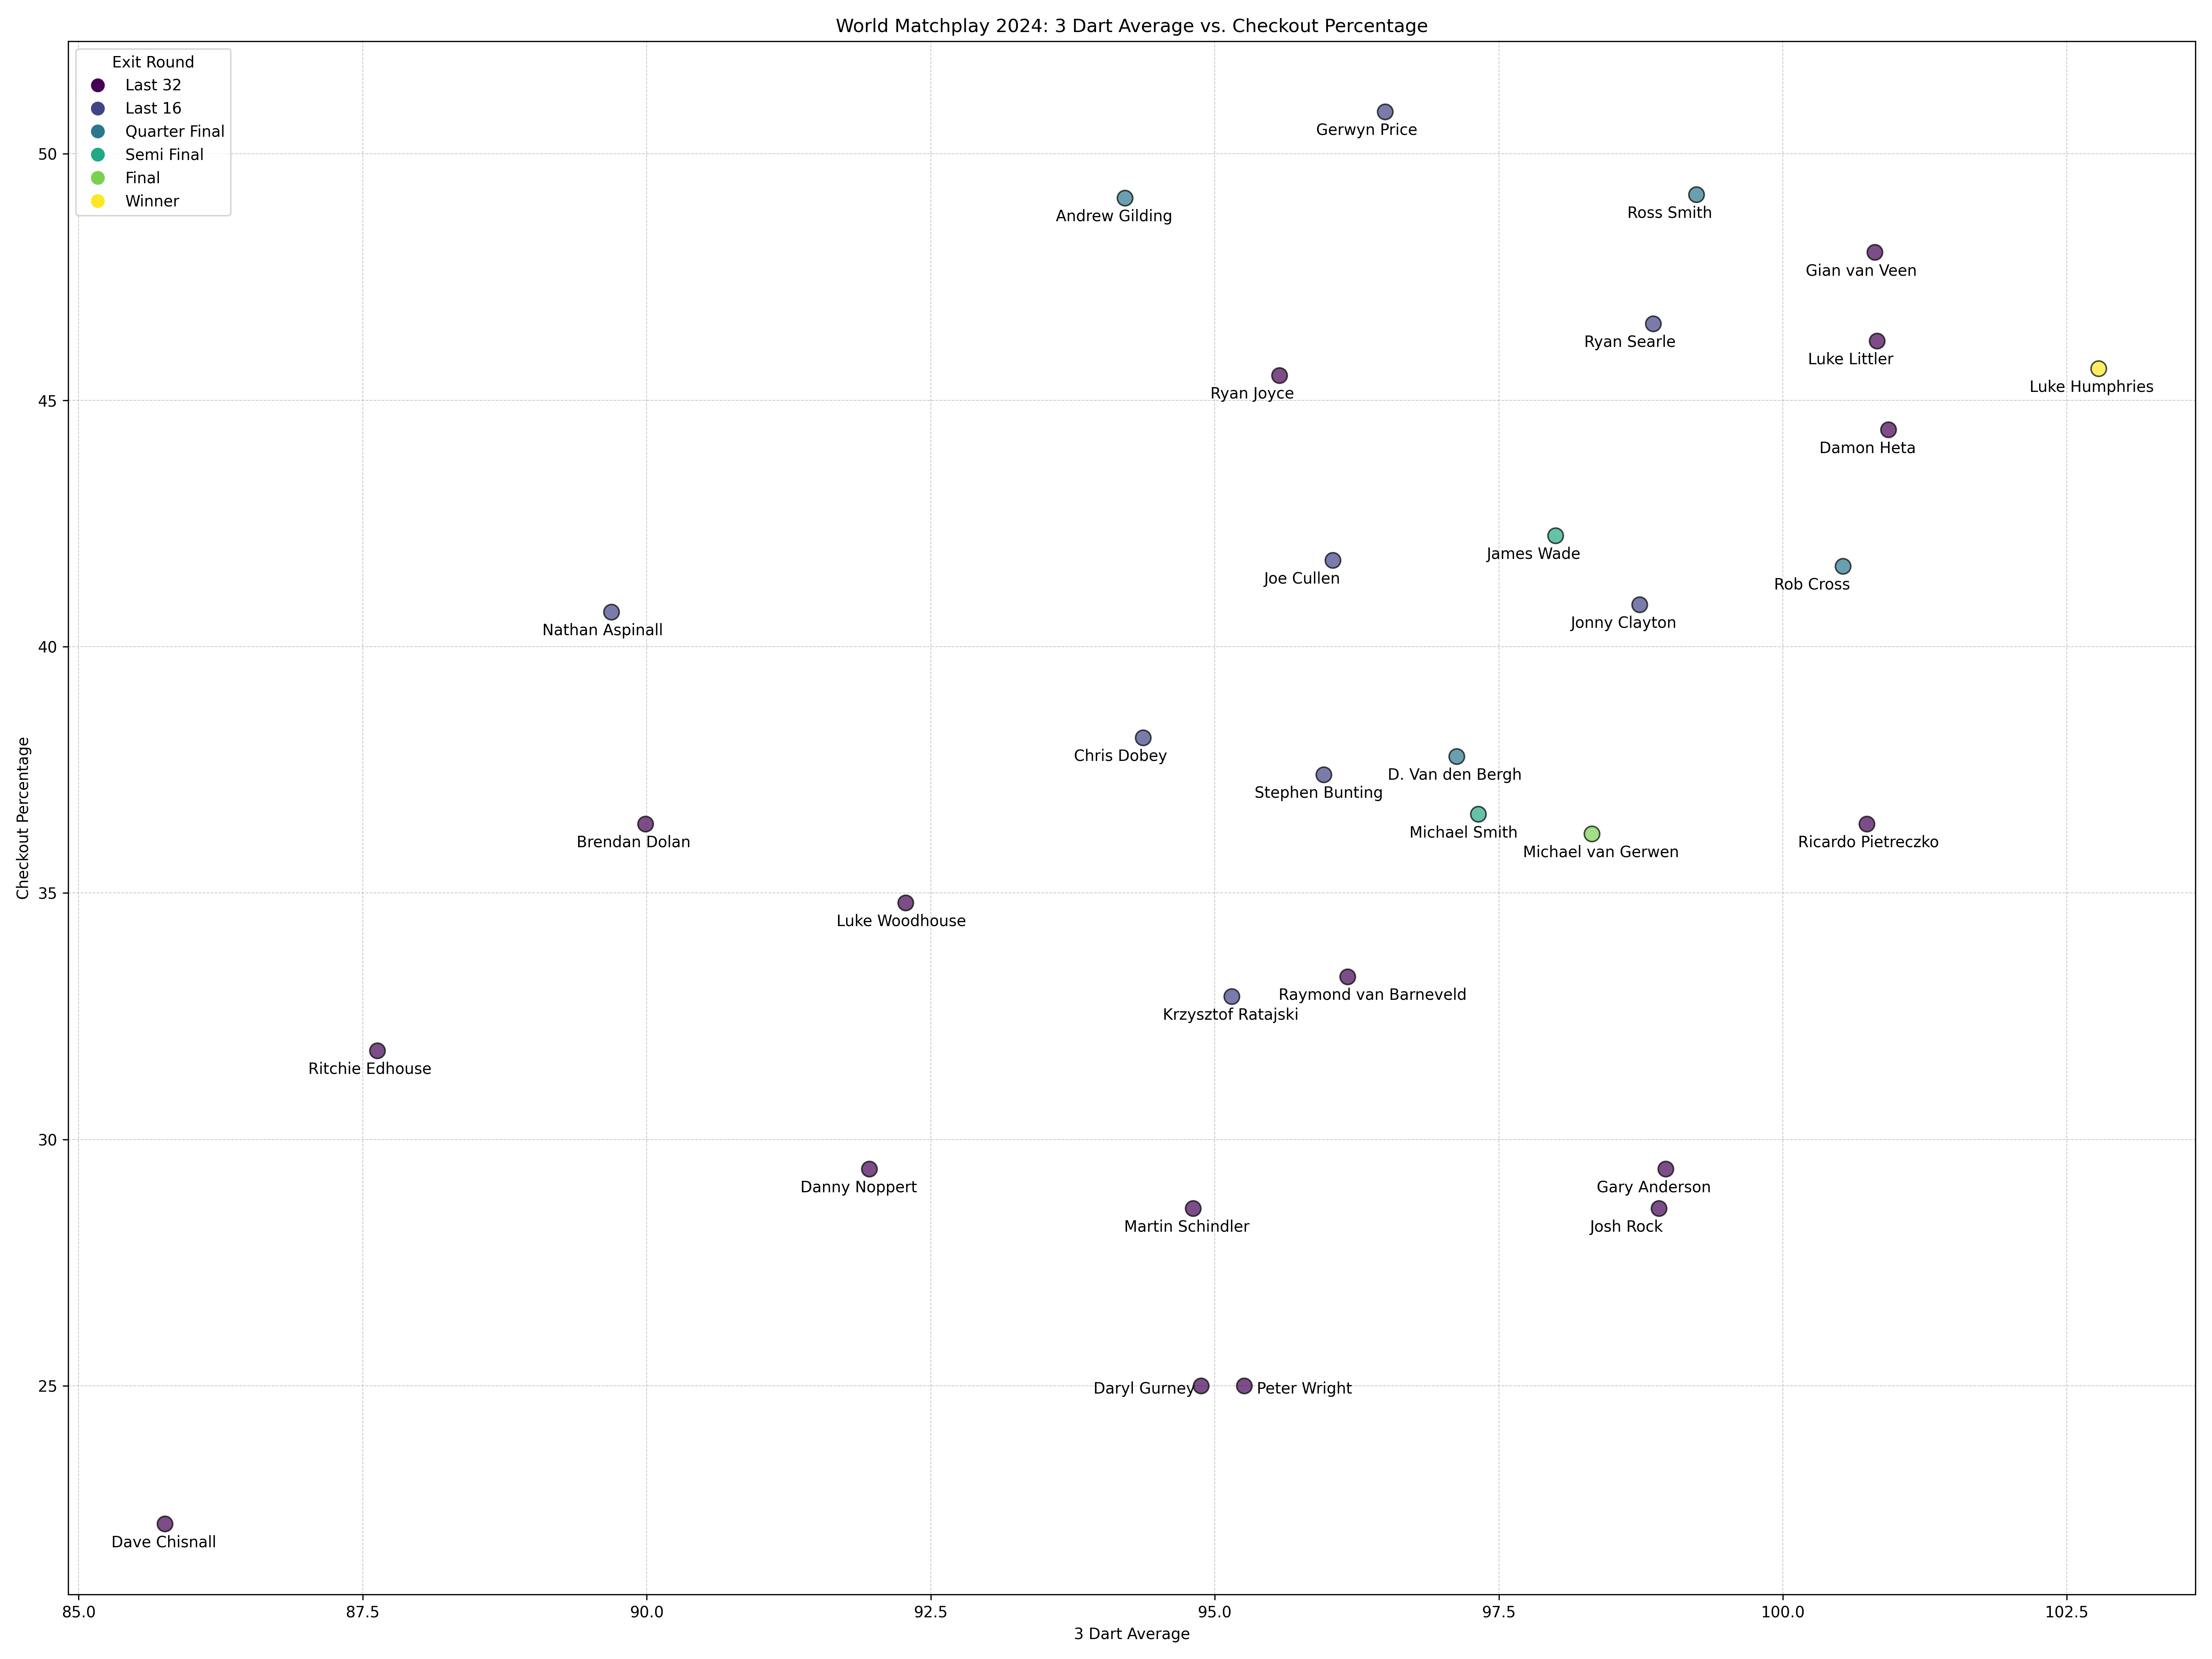
Figure 4: A scatter plot of average tournament 3 dart average against average checkout rate. Top right means good at both.
Humphries was an absolute machine and fully deserved the title. He carried his freakish 2023 form straight through the winter and into Blackpool. He posted the highest average of the tournament despite playing the maximum number of legs. Only four other players managed a 100+ average, and Rob Cross was the only one of them to actually survive the first round.
Speaking of the first round, spare a thought for Gian Van Veen and Luke Littler. They both played brilliantly but had the terrible luck of drawing the 3rd and 4th best players in the world right out of the gate. Ricardo Pietreczko also gave Humphries a real scare but missed his doubles when it mattered most.
Michael Van Gerwen sits closer to the middle of the scatter plot. His numbers were not as scary as some of the others but he stepped up exactly when he needed to.
For me, James Wade was the real story of the week. Nobody gave him a chance. He scraped into the tournament by the skin of his teeth, then somehow found his vintage form. He banged in 180s for fun and took out his doubles with ridiculous efficiency. His run to the semis was pure class and had zero luck involved.
Wrap-up
So, can a machine predict the darts? Yes and no. The algorithm was great at calling the clear mismatches but got a bit lost in the weeds when two players were evenly matched. That is probably just the magic of the Matchplay. I will definitely be spinning this code up again for future tournaments. It needs a bit of fine-tuning, but beating thousands of people in the official predictor game was a very nice bonus.