Algorithm on the Oche: Darts World Championship 2025
Want to see how the tournament odds bounced around in real time? Check out my Darts Tournament Odds tracker to watch the probabilities jump around as the championship unfolded.
Algorithm on the Oche
The 2025 PDC World Darts Championship is done and dusted. The £2.5 million prize pot has been handed out, the Sid Waddell Trophy has a new home, and the entire sporting world is still recovering from the absolute whirlwind that is Luke Littler. From mid-December right through to early January, Alexandra Palace gave us peak sporting drama.
The headline is obviously Littler. The teenager casually dismantled a field of seasoned pros and capped it off by beating Michael van Gerwen 7-3 in the final. We saw him drop an absurd 140.91 average in a single set against Ryan Meikle. But it wasn't just the Littler show. Reigning champ Luke Humphries got dumped out by Peter Wright. Callan Rydz made a brilliant run to the quarter-finals. The Ally Pally crowd absolutely lost its mind for two nine-darters from Christian Kist and Damon Heta. Littler did hit a bit of a speed bump shortly after the world championship when he crashed out early at the Bahrain Darts Masters. Stephen Bunting ended up taking that trophy home, proving that the darting gods are nothing if not fickle.
Before a single dart hit the board, I had my algorithms running in the background. My goal was simple. I wanted to predict the unpredictable. Now that the dust has settled, it is time to grade my homework and see how my predictive model actually handled the chaos.
Grading the Crystal Ball
The model spat out win probabilities for every match. Overall it nailed 59 predictions and missed 35, giving me a solid 62.77% accuracy rate. Let us look at how it tracked the two finalists.
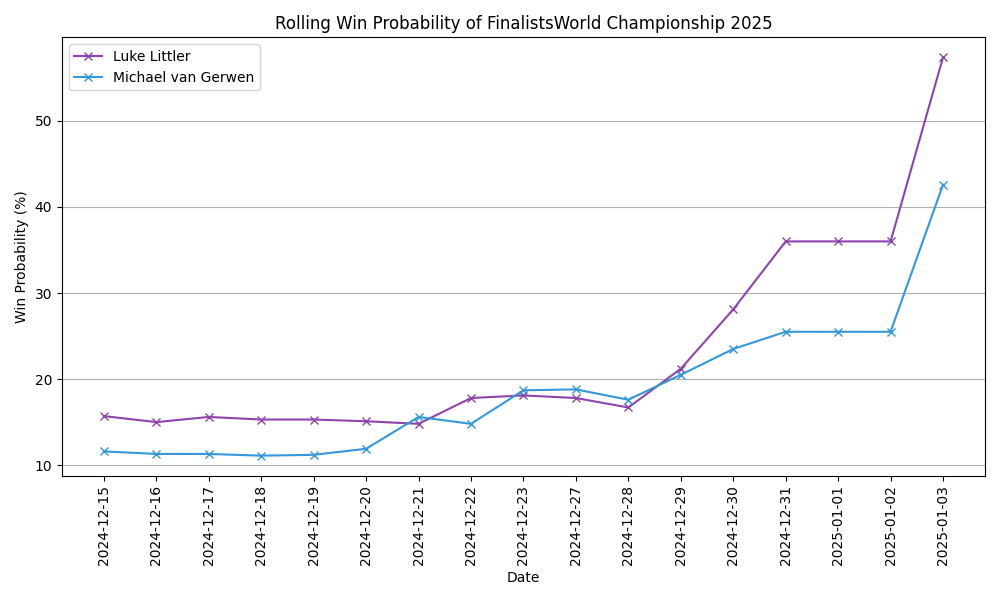 Figure 1. The changes in win probability of the two finalists throughout the tournament.
Figure 1 shows the rolling win probability for Littler and Van Gerwen. The algorithm pegged Littler as an early favourite. MVG occasionally overtook him in the estimations whenever he had a particularly strong showing. The biggest shift happened when Luke Humphries crashed out in the fourth round. Humphries and Littler were on a collision course for the semi-finals, and the model originally favoured Humphries. Once Humphries was on the train home, Littler's odds naturally skyrocketed.
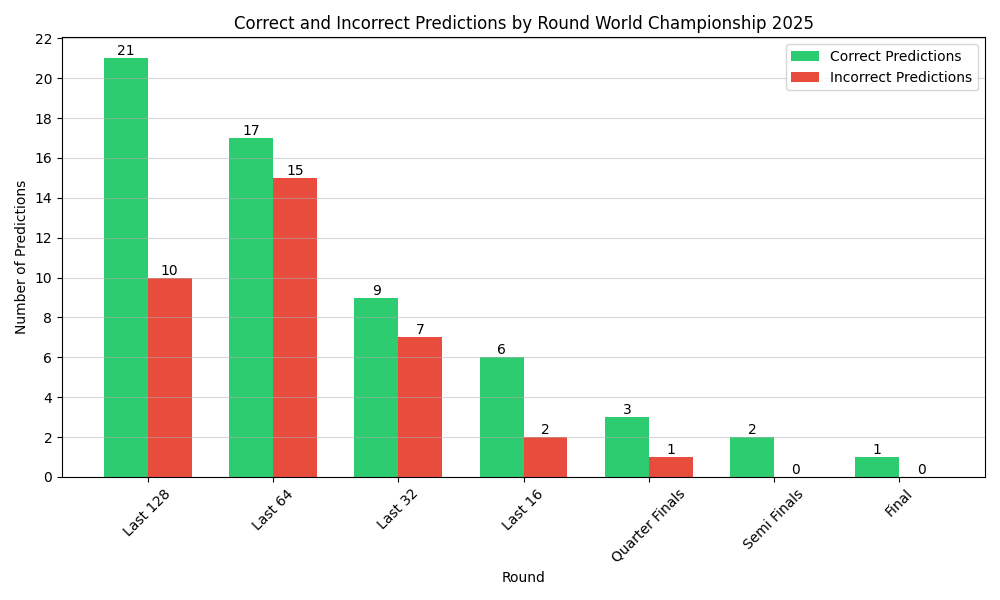 Figure 2. The number of correct and incorrect predictions made by my model at each stage.
I was genuinely relieved to see more green than red across every single round. The model found its groove in the later stages, missing only a single prediction from the quarter-finals onwards. You might expect the early rounds to be easier to predict because of obvious skill mismatches. Yet my code actually preferred the longer set-play format at the business end of the tournament. More sets seem to mean less room for statistical flukes.
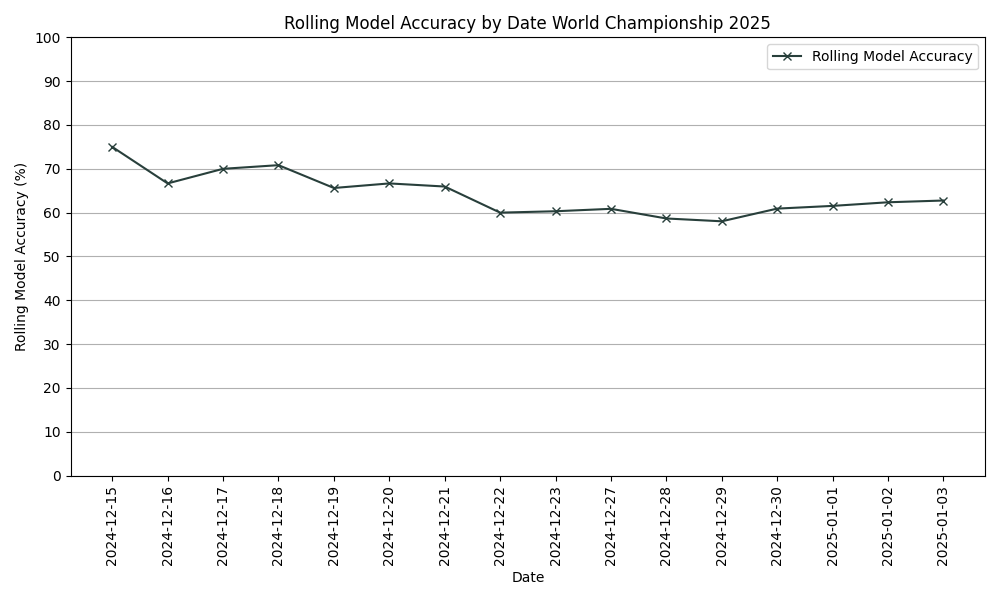 Figure 3. The rolling model accuracy throughout the tournament.
Tracking the accuracy day by day shows a clear trend. After some early turbulence, the model found its footing around December 22nd and hovered comfortably at the 62% mark for the rest of the event. Live sports are inherently volatile, so I will happily take a consistent 62% hit rate.
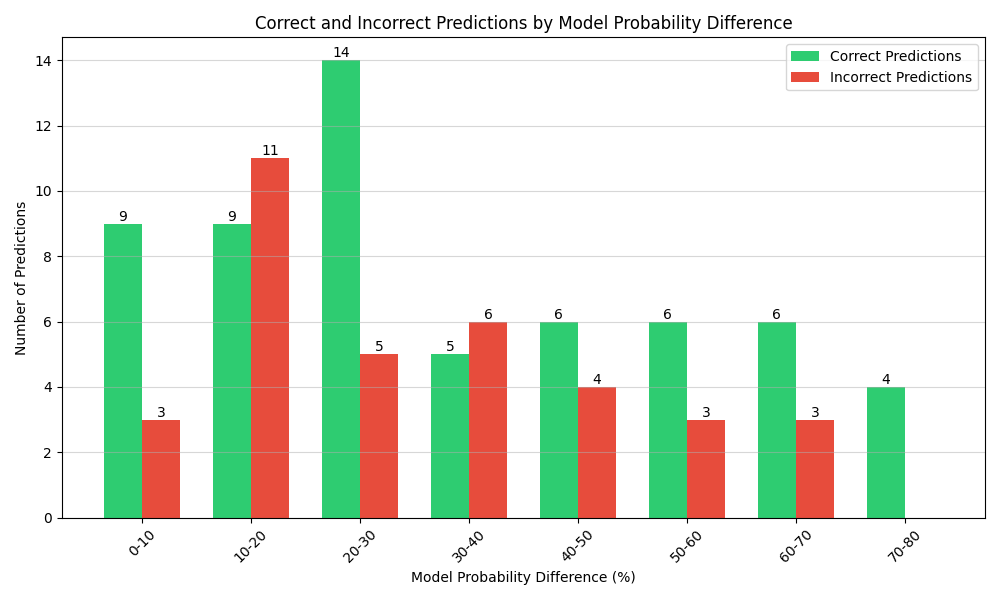 Figure 4. The number of correct and incorrect predictions made by my model at each stage.
Does a confident model mean a correct model? Yes and no. Matches where the model only saw a tiny 0 to 10% edge actually resulted in a surprisingly high number of correct calls. Oddly enough, the 10 to 20% bucket was a bit of a disaster zone with more misses than hits. If the algorithm was absolutely certain with a 70 to 80% gap, it never missed. But the messy middle just proves that darts matches are won on the stage and not in a spreadsheet.
Pre-Tournament Expectations vs. Reality
It is always fun to look back at the starting grid. Let us see who the computer liked before a single dart was thrown.
| Player | Pre-Tournament Winning Odds (%) | Exit Round | |
|---|---|---|---|
| 1 | Luke Humphries | 21.4 | Last 16 |
| 2 | Luke Littler | 15.7 | Winner |
| 3 | Michael van Gerwen | 11.6 | Final |
| 4 | Josh Rock | 5.6 | Last 32 |
| 5 | Gary Anderson | 4.3 | Last 64 |
| 6 | Jonny Clayton | 4 | Last 16 |
| 7 | Mike de Decker | 3.7 | Last 64 |
| 8 | Stephen Bunting | 3.1 | Semi Finals |
| 9 | Wessel Nijman | 2.9 | Last 64 |
| 10 | Michael Smith | 2 | Last 64 |
The algorithm crowned Luke Humphries the pre-tournament favourite at 21.4%, which looked great right up until his Last 16 exit. Luke Littler was sitting second at 15.7%, which feels remarkably prescient in hindsight. Michael van Gerwen was right behind him at 11.6%. The big blind spot was Stephen Bunting. The model gave him a measly 3.1% chance, but he threw some incredible darts to reach the semi-finals.
The Beautiful Chaos of Darts
So how did the machine hold up? It successfully flagged the two finalists before a dart was even thrown and generally performed better as the pressure mounted in the later rounds.
But a purely mathematical model will always struggle to capture the human element. You cannot quantify the pressure of the Ally Pally crowd or predict a teenager casually ignoring decades of darts orthodoxy. Luke Humphries crashing out early and Luke Littler rewriting the history books are exactly why we watch the sport.
My algorithm can crunch the numbers all day long. Thankfully, the darts themselves are still delightfully unpredictable.