Theme Park Visitor Modelling
Project focused on predicting theme park crowd levels and ride wait times using historical data, machine learning models and a Streamlit dashboard for interactive exploration.
This project builds toward predicting wait times at individual theme park rides. The crowd level piece (predicting overall park busyness on a given day) is finished and usable via a Streamlit dashboard. Per-ride queue time prediction is in progress and will build on top of it.
The stack is end-to-end, with a Playwright-based scraper collecting historical queue time data, a Bayesian-tuned Random Forest trained on that data, and the dashboard wrapping inference in something you can actually click around in.
The problem
Park busyness forecasting already exists in various forms, such as the odd website, or guides written by people who've been to Disney enough times that it stopped being fun. The gap is at the ride level. Knowing a park will be "moderately busy" on a Saturday does not tell you which rides are worth queueing for at 10am, or whether the wait for a particular rollercoaster will be 20 minutes or an hour.
This project works toward that, with the crowd level model as the foundation. Predicting park-level busyness from historical queue time data is the first step, then per-ride predictions will build on top of it. The crowd level piece is finished and working. The ride-level piece is next.
Data collection
Queue time data comes from Queue Times, a site that tracks live wait times across hundreds of parks worldwide. There is no public API, so the scraper is built with Playwright and drives a real browser session to log in and pull the historical data.
All readings land in a local SQLite database at data/queue_data.db, with one row per ride per 15-minute interval, with the date, time, queue time in minutes, and a flag for whether the ride was closed. Parks, date ranges, and months to exclude (for parks that close over winter) are configured in config.yml.
Defining "crowd level"
The target variable is a per-park percentile rank of average daily queue time, scaled 0–100. The process:
- Filter out closed-ride readings.
- Average each ride's queue times within a day to get a daily figure per ride.
- Average those figures across all rides in the park to get a single daily park-level number.
- Rank each day within its park using
rank(pct=True)— so a score of 70 means the park was busier than 70% of its historical days.
Using a percentile rank rather than raw minutes makes the target stable across retrains and comparable across parks of different sizes. A park with 30 rides and one with 10 rides will produce scores on the same 0–100 scale.
Feature engineering
The preprocessing pipeline assembles six categories of features for each date and park combination.
Date features. Day of week and month are one-hot encoded (7 and 12 columns respectively). These are derived entirely from the date, so they require no external calls.
Bank holidays. Fetched from the Nager.Date API per country per year. The pipeline resolves each park's country from its Queue Times ID, uses pycountry to convert the country name to an ISO code, and batches the API calls so parks in the same country share a single request.
School holidays. This is the one genuinely unusual step. School holiday dates are generated by Google Gemini (gemini-2.0-flash by default). The pipeline sends a structured prompt asking for a JSON array of holiday periods for a given country and year range, then expands those date ranges into individual date flags. School holidays are a big driver of park busyness and are, irritatingly, not available from any clean programmatic source. Asking an LLM turned out to be the most practical option. If GOOGLE_AI_API_KEY is not set, the step is skipped gracefully.
Opening hours. For historical dates, opening and closing times come from the local database — the first and last time_of_day values recorded for that park on that date. For future dates, they are fetched from the ThemeParks.wiki API, which requires mapping Queue Times IDs to ThemeParks.wiki entity IDs via a name-based lookup. The features produced are opening_hr, closing_hr, and hours_open_for.
Weather. Training uses historical daily observations from Meteostat — mean temperature, precipitation, and wind speed. For inference, dates within approximately 16 days use the Open-Meteo forecast API (no key required). Dates beyond that horizon fall back to five-year historical monthly averages computed from Meteostat, so predictions remain possible for any future date without having to refuse or guess.
Park identity. park_id is one-hot encoded so the model can learn park-specific baselines. Lat/long coordinates (from queue-times.com/parks.json) are used only to anchor the weather queries and are not passed to the model.
Model training
The model is a Random Forest regressor tuned with Bayesian optimisation via scikit-optimize. The search space covers n_estimators, max_depth, min_samples_split, min_samples_leaf, and max_features, and runs for 20 iterations.
Cross-validation uses TimeSeriesSplit (5 folds) rather than standard k-fold. This matters as with k-fold and shuffled data, earlier folds can see future dates during validation, which flatters the cross-validation score in a way that does not generalise. Time series split preserves temporal order.
The trained model and a saved list of feature column names are exported to model-exports/ as .pkl files. The column list is needed at inference time to align one-hot encoded park columns to the exact shape the model was trained on, as, without it, a park that was not in the training data would produce a silently misaligned feature matrix.
| Metric | Value |
|---|---|
| RMSE | 17.78 |
| MAE | 14.31 |
| R² | 0.633 |
| MSE | 316.19 |
On a 0–100 scale, an MAE of 14.3 means the model's predictions are typically about 14 percentile points away from the actual value. So if it predicts a crowd level of 60, the real figure will usually land somewhere between 45 and 75. That is not precise enough to tell you whether Tuesday will be marginally quieter than Wednesday, but it is good enough to meaningfully distinguish the quieter days from busier ones, which is what most people actually need when planning a trip.
R² of 0.633 means the model accounts for about 63% of the variance in crowd level. The remaining 37% is things the model cannot see, such as a ride closing unexpectedly for a number of days, a promotional event (this is hard to gauge consistently from the available APIs) or a school that breaks up a week earlier than most. That is probably about as far as you can get with publicly available features. Predicting human behaviour at scale tends to top out somewhere around here.
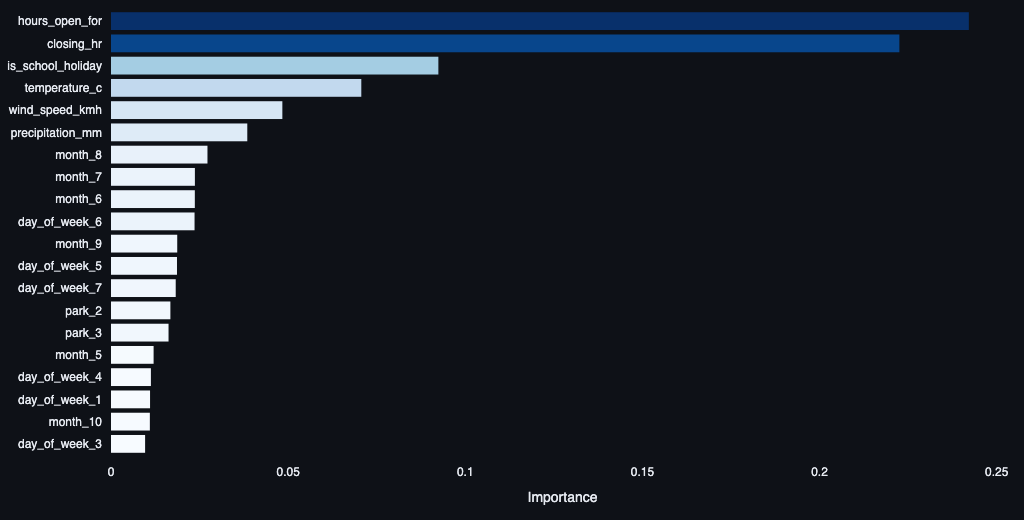 Figure:
 hours_open_for and closing_hr dominate, but this is partly a proxy effect, i.e. parks that open longer tend to do so on days they expect to be busy. The model is picking up a real signal, though it conflates cause and effect somewhat. School holiday status and weather variables follow at a meaningful distance. Calendar encodings and park identity features contribute but none individually come close to the opening hours signal.
Inference
The inference pipeline runs the same preprocessing steps over a set of future dates and produces predictions from the saved model. The main difference from training is the weather source — Open-Meteo for near-term dates, Meteostat historical averages as a fallback for anything further out.
Confidence is estimated by collecting predictions from each individual tree in the forest and computing the standard deviation. The ±1σ band this produces is a rough measure of uncertainty, but it is cheap to compute and tracks the cases where the trees disagree most — typically unusual dates or parks with thinner training data.
Dashboard
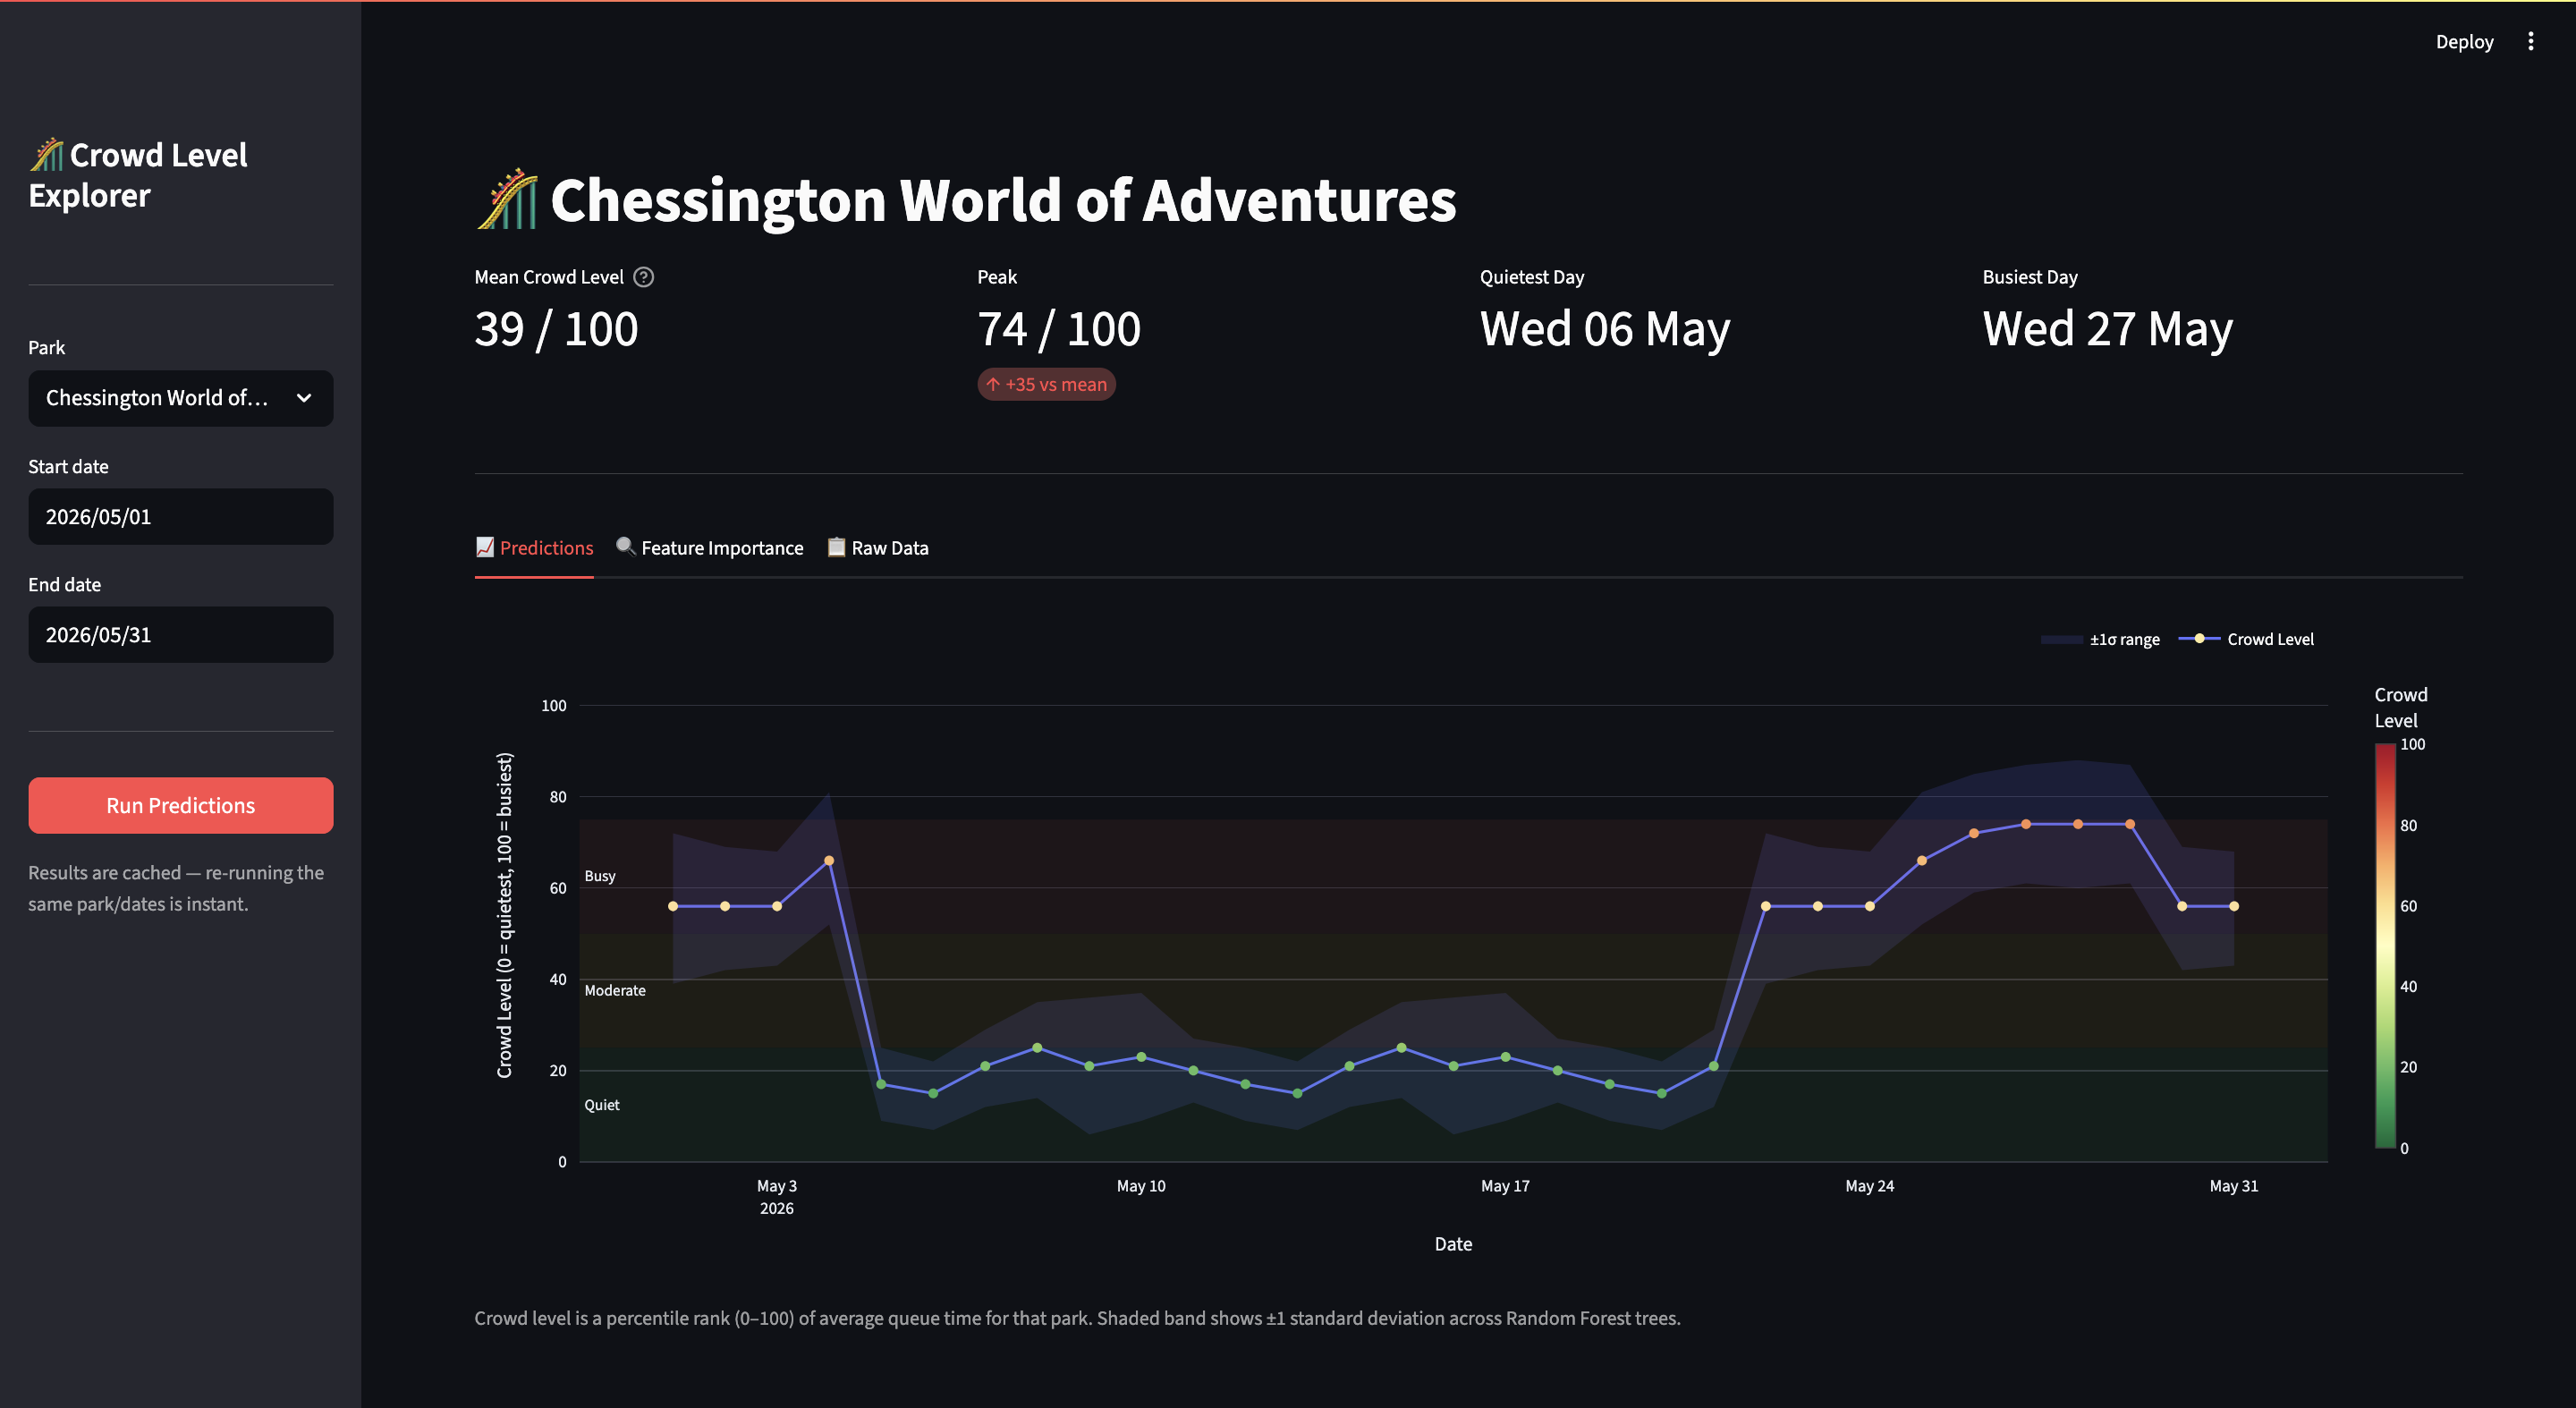
The Streamlit dashboard (dashboard/app.py) wraps the inference pipeline in an interactive UI. You pick a park from the list configured in config.yml, set a start and end date, and click Run Predictions.
It returns:
- A time-series chart of predicted crowd level with the ±1σ confidence band
- Summary metrics: mean, peak, quietest day, busiest day
- A feature importance chart for the trained model
- A downloadable CSV of the raw predictions
Results are cached in session state, so re-running the same park and date range is instant.
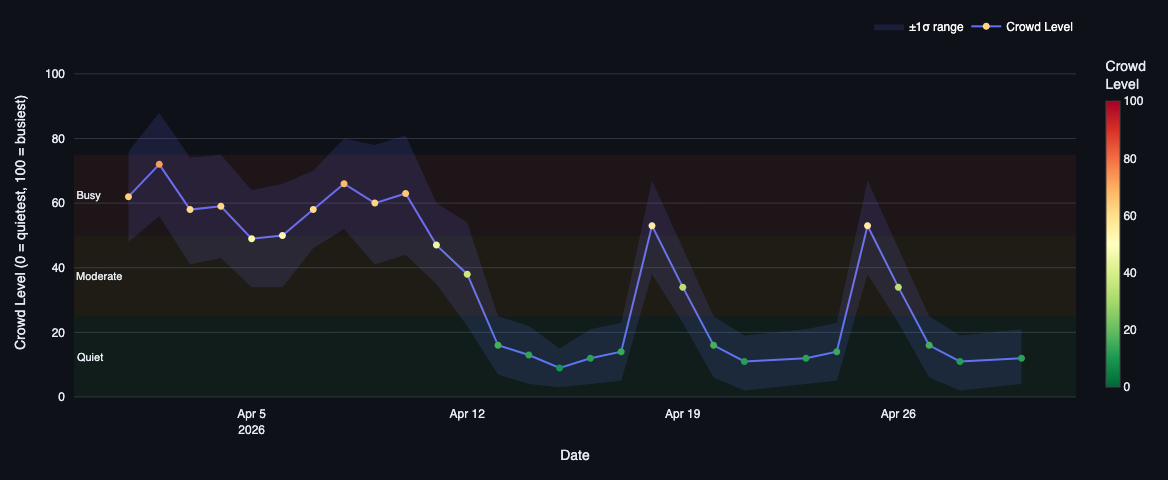 Figure: Predicted crowd levels for Thorpe Park across April and early May 2026. The Easter bank holiday cluster drives the elevated readings in early April, with the school holiday period sustaining higher levels through the first two weeks. As the holidays end, the model drops sharply into the mid-April trough. From there, the pattern shifts to a weekend-driven rhythm — the spikes on 18 and 25 April land on Saturdays, with quieter mid-week readings either side. The ±1σ band is widest around the bank holiday and weekend peaks, where the trees disagree most, and narrows through the quieter weekday stretches.
Tech stack
| Area | Tools |
|---|---|
| Browser automation | Playwright |
| Data storage | SQLite (sqlite3) |
| Bank holidays | Nager.Date API |
| School holidays | Google Gemini (google-genai) |
| Opening hours (future dates) | ThemeParks.wiki API |
| Weather (training) | Meteostat |
| Weather (inference) | Open-Meteo forecast / Meteostat fallback |
| Country resolution | pycountry |
| Model | scikit-learn Random Forest |
| Hyperparameter tuning | scikit-optimize (Bayesian search) |
| Dashboard | Streamlit + Plotly |
What's next
The models/queues/ directory is the start of the per-ride queue time model. The crowd level score will feed in as a feature, alongside ride-specific history, opening hours, and whatever else turns out to matter. It is a harder problem, with more variables, sparser data for less popular rides and no clean source for ride-level features like capacity or throughput. However, the data collection infrastructure is already there, which is usually the annoying part.