The Lazy Manager's Guide to FPL Success Part 2 (2024/25)
Last year I tried a weird little experiment for the 2023/24 Fantasy Premier League season. I wanted to see what happens if you pick fifteen players before the first game, never touch the team again, and let perfect hindsight take the wheel. The answer was 2,656 points. That was enough for a top 250 global finish out of eleven million players.
I obviously had to run it again for the 24/25 season. Same code, same constraints, different season. The full GitHub repo is here and the methodology is identical to last year's write-up. I'll spare you the deep dive into the code this time. The short version is that PuLP solves for a fifteen-player squad under £100m that maxes out total season points. It handles the captaincy doubling, auto-subs and vice-captain promotions when your main guy gets benched.
The Results
The 24/25 optimal static team scored 2,640 points.
That's just 16 points shy of last year's total. It sounds pretty much identical. But in the harsh reality of FPL rankings, the gap is massive. Last season 2,656 points got you into the top 250 worldwide. This season 2,640 points dragged you down to 1,667th. It's essentially the same score but an undeniably worse rank.
The 24/25 season clearly bred a mutant strain of highly effective FPL managers at the top. The optimal lazy team is still ridiculous by any normal standard, but active managers with good timing found a much higher ceiling this year.
The squad averaged 69.5 points per gameweek. That's incredibly close to last season's 69.9. The algorithm kept its consistency, but the human competition got significantly sweatier.
Man vs Machine
Figure 1 puts the optimised team's cumulative score right next to my own real-world tragedy of a season.
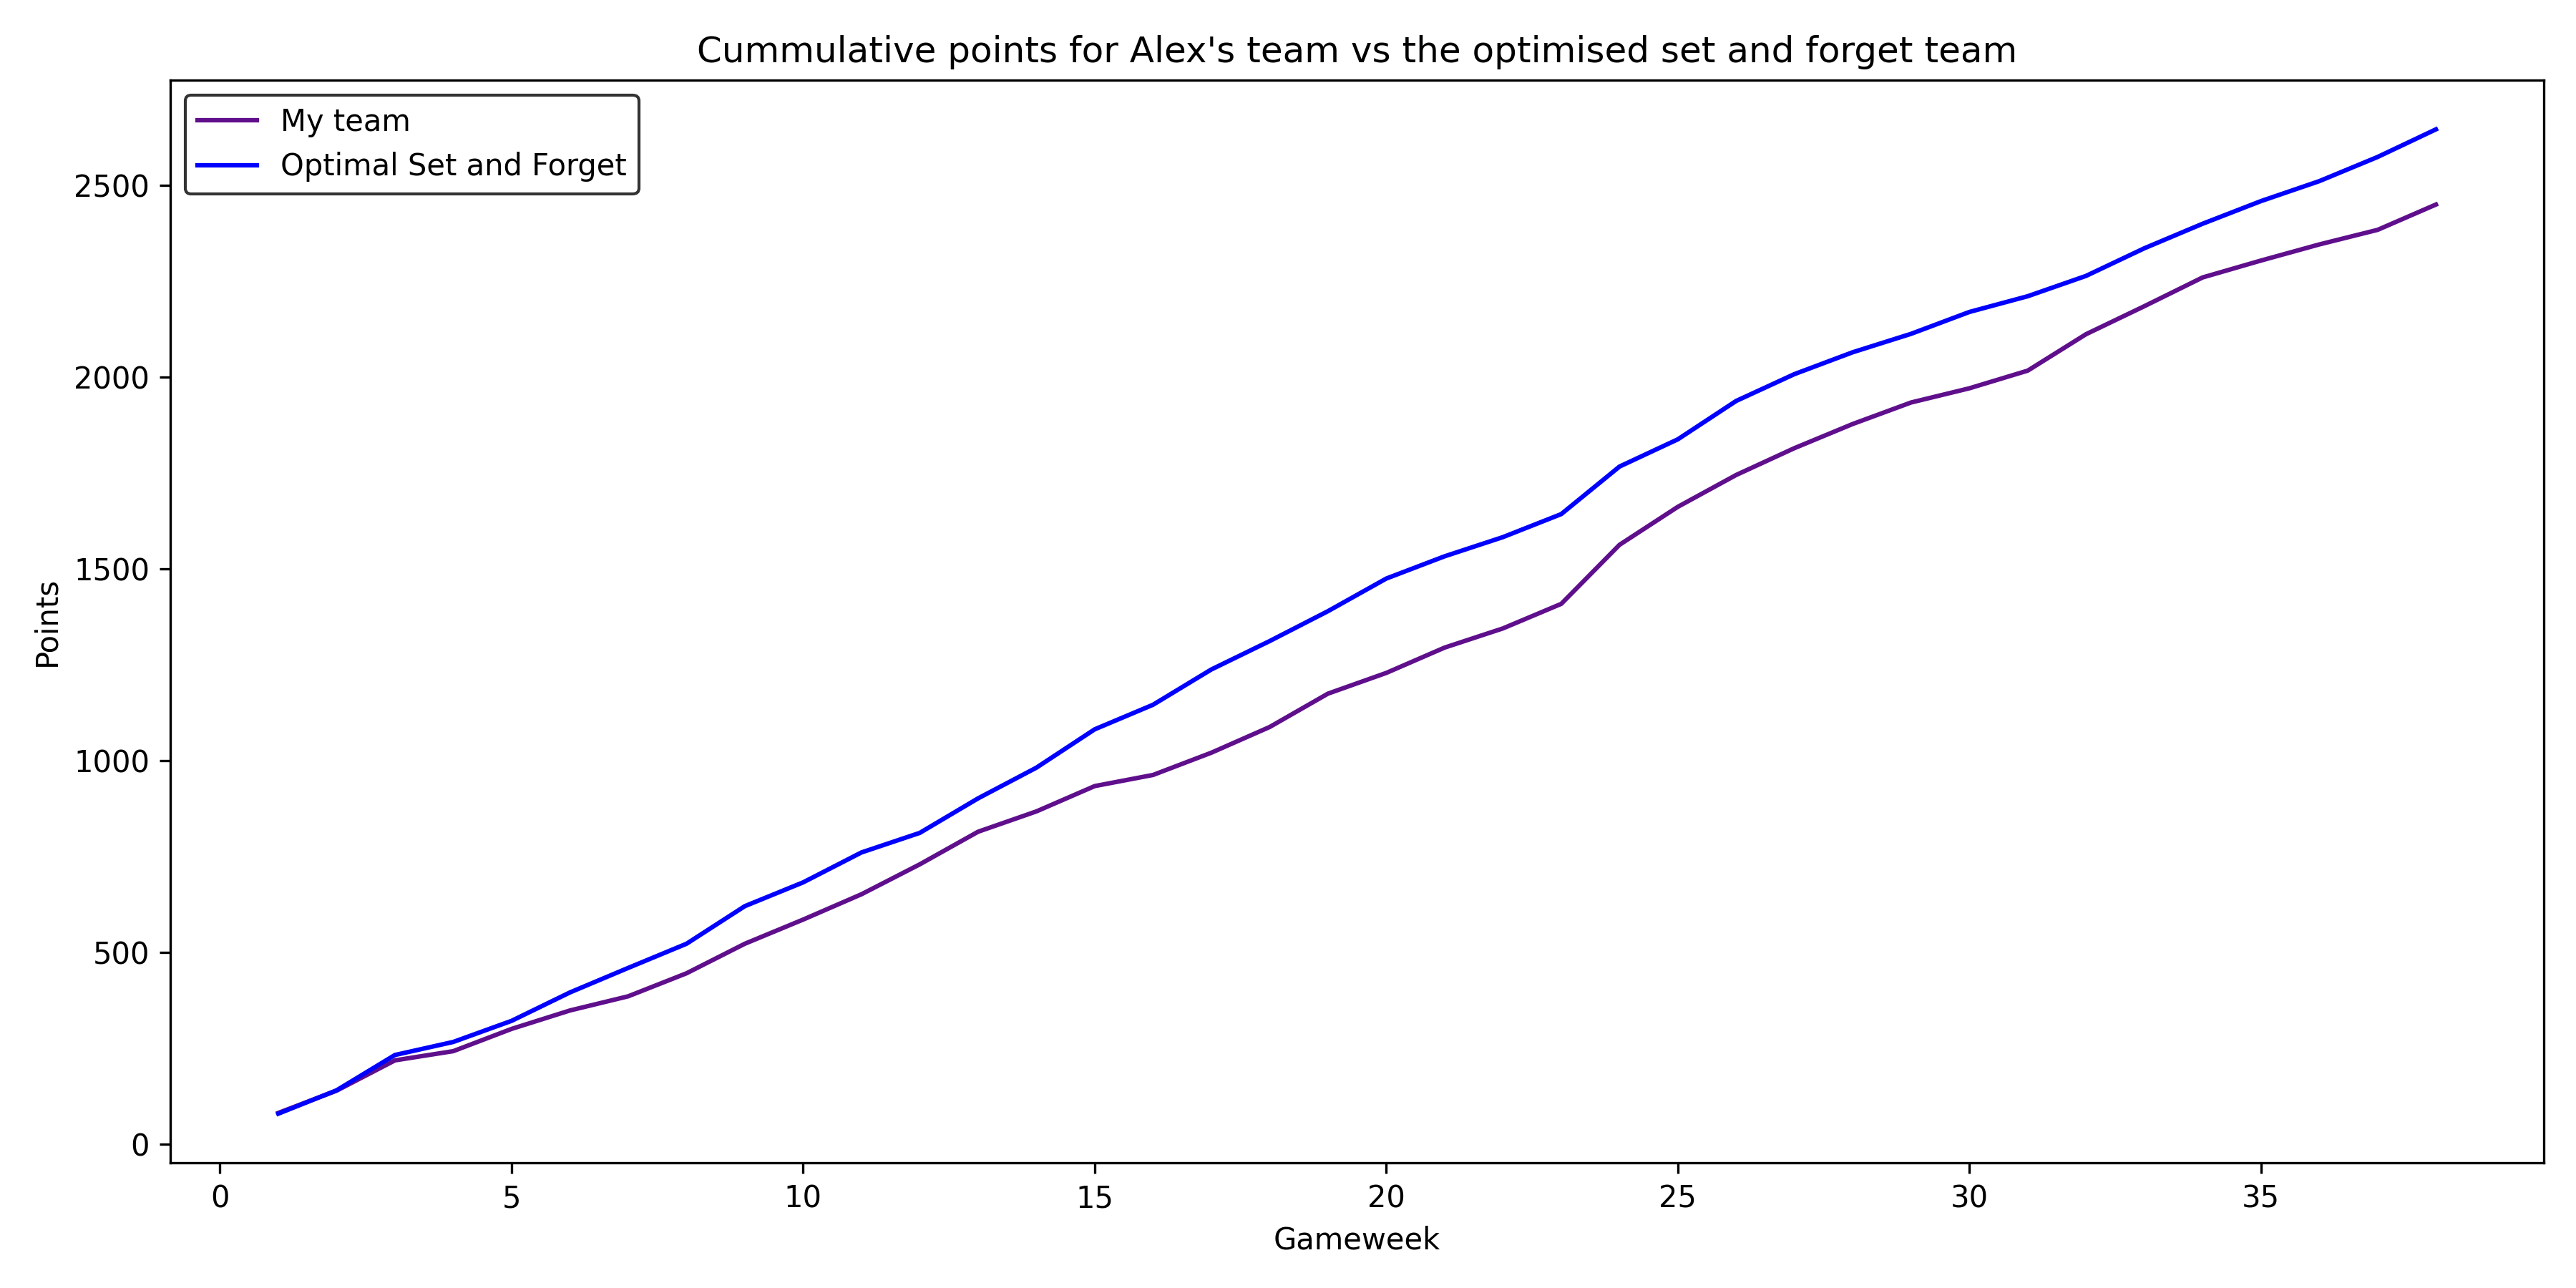 Figure 1. Cumulative points scored by me versus the optimal set-and-forget team.
I'll let you guess my actual finishing rank. Let's just say it wasn't great.
Figure 2 tracks the week-by-week difference from the global average. The 24/25 algorithmic team had exactly the same number of gameweeks below the average score, but you might say it actually hit more 'rough patches' vs last year's version, which suffered 3/5 of its underpeforming weeks in the first four gameweeks.
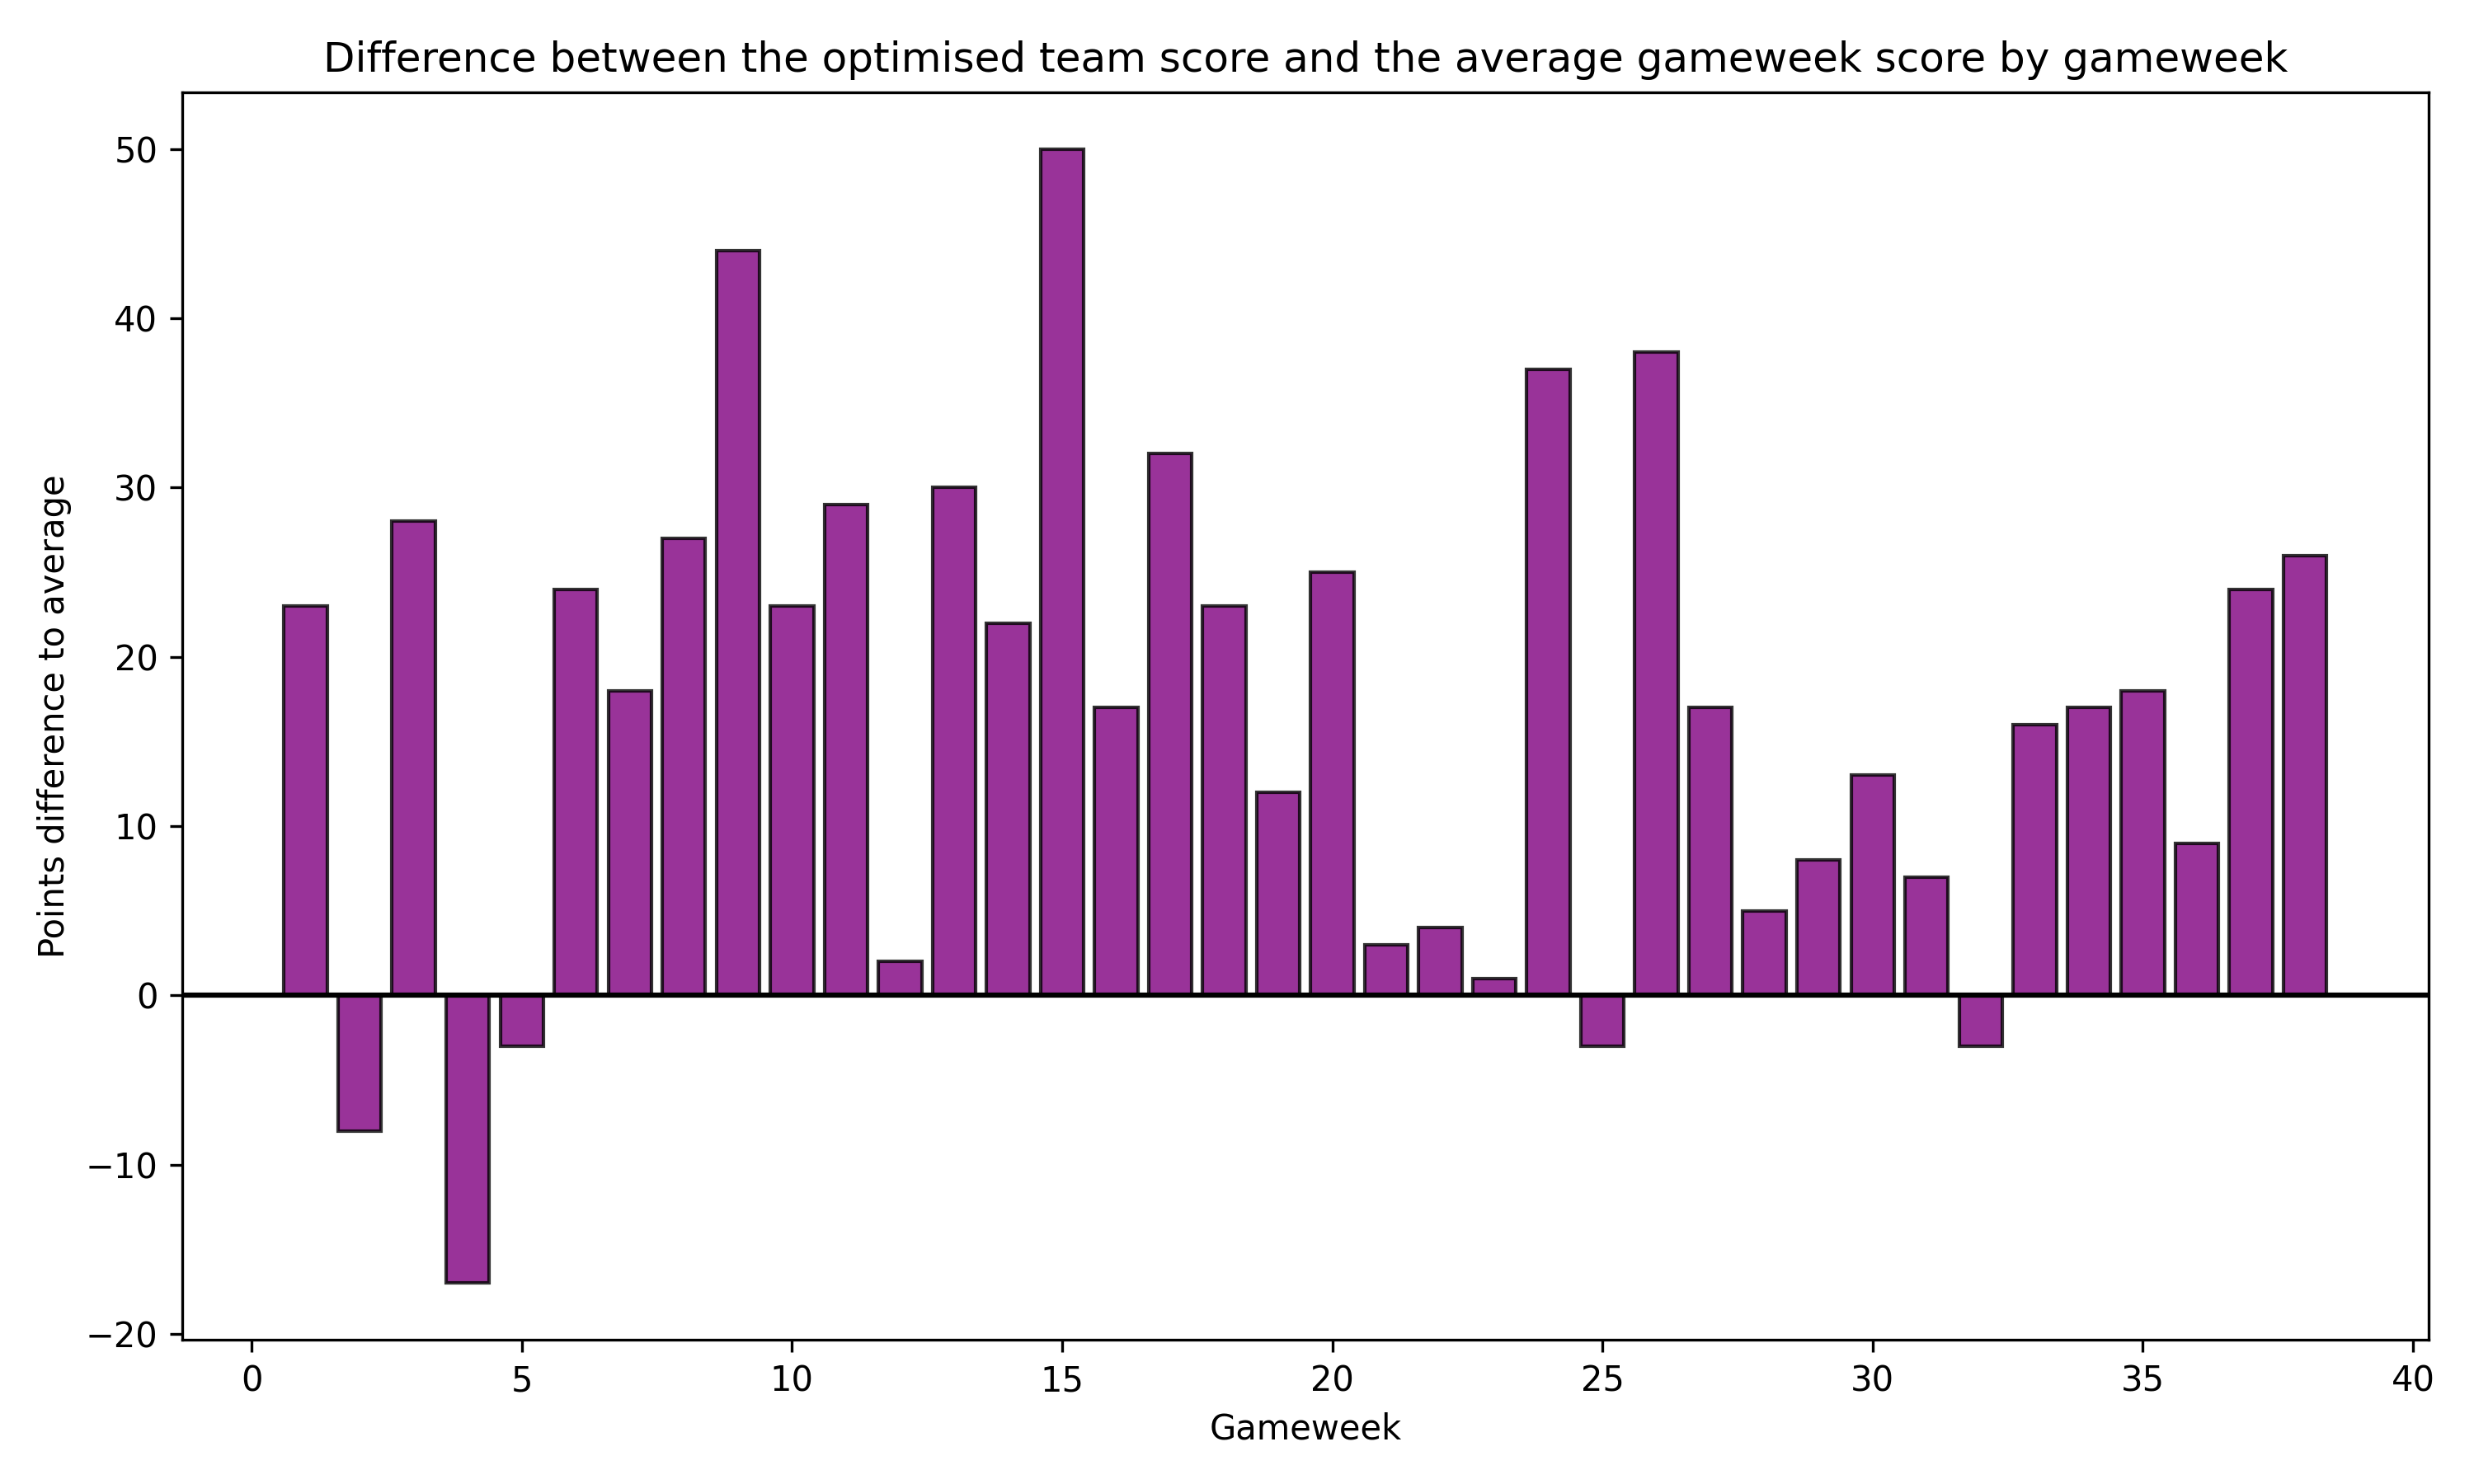 Figure 2. Difference in points scored by the optimised team versus the global average.
Gameweek 4 was the absolute floor with a miserable 34 points. Gameweek 24 was the pinnacle at 124 points, mostly due to reasons I'll get to in a second.
Figure 3 maps out the distribution of weekly scores.
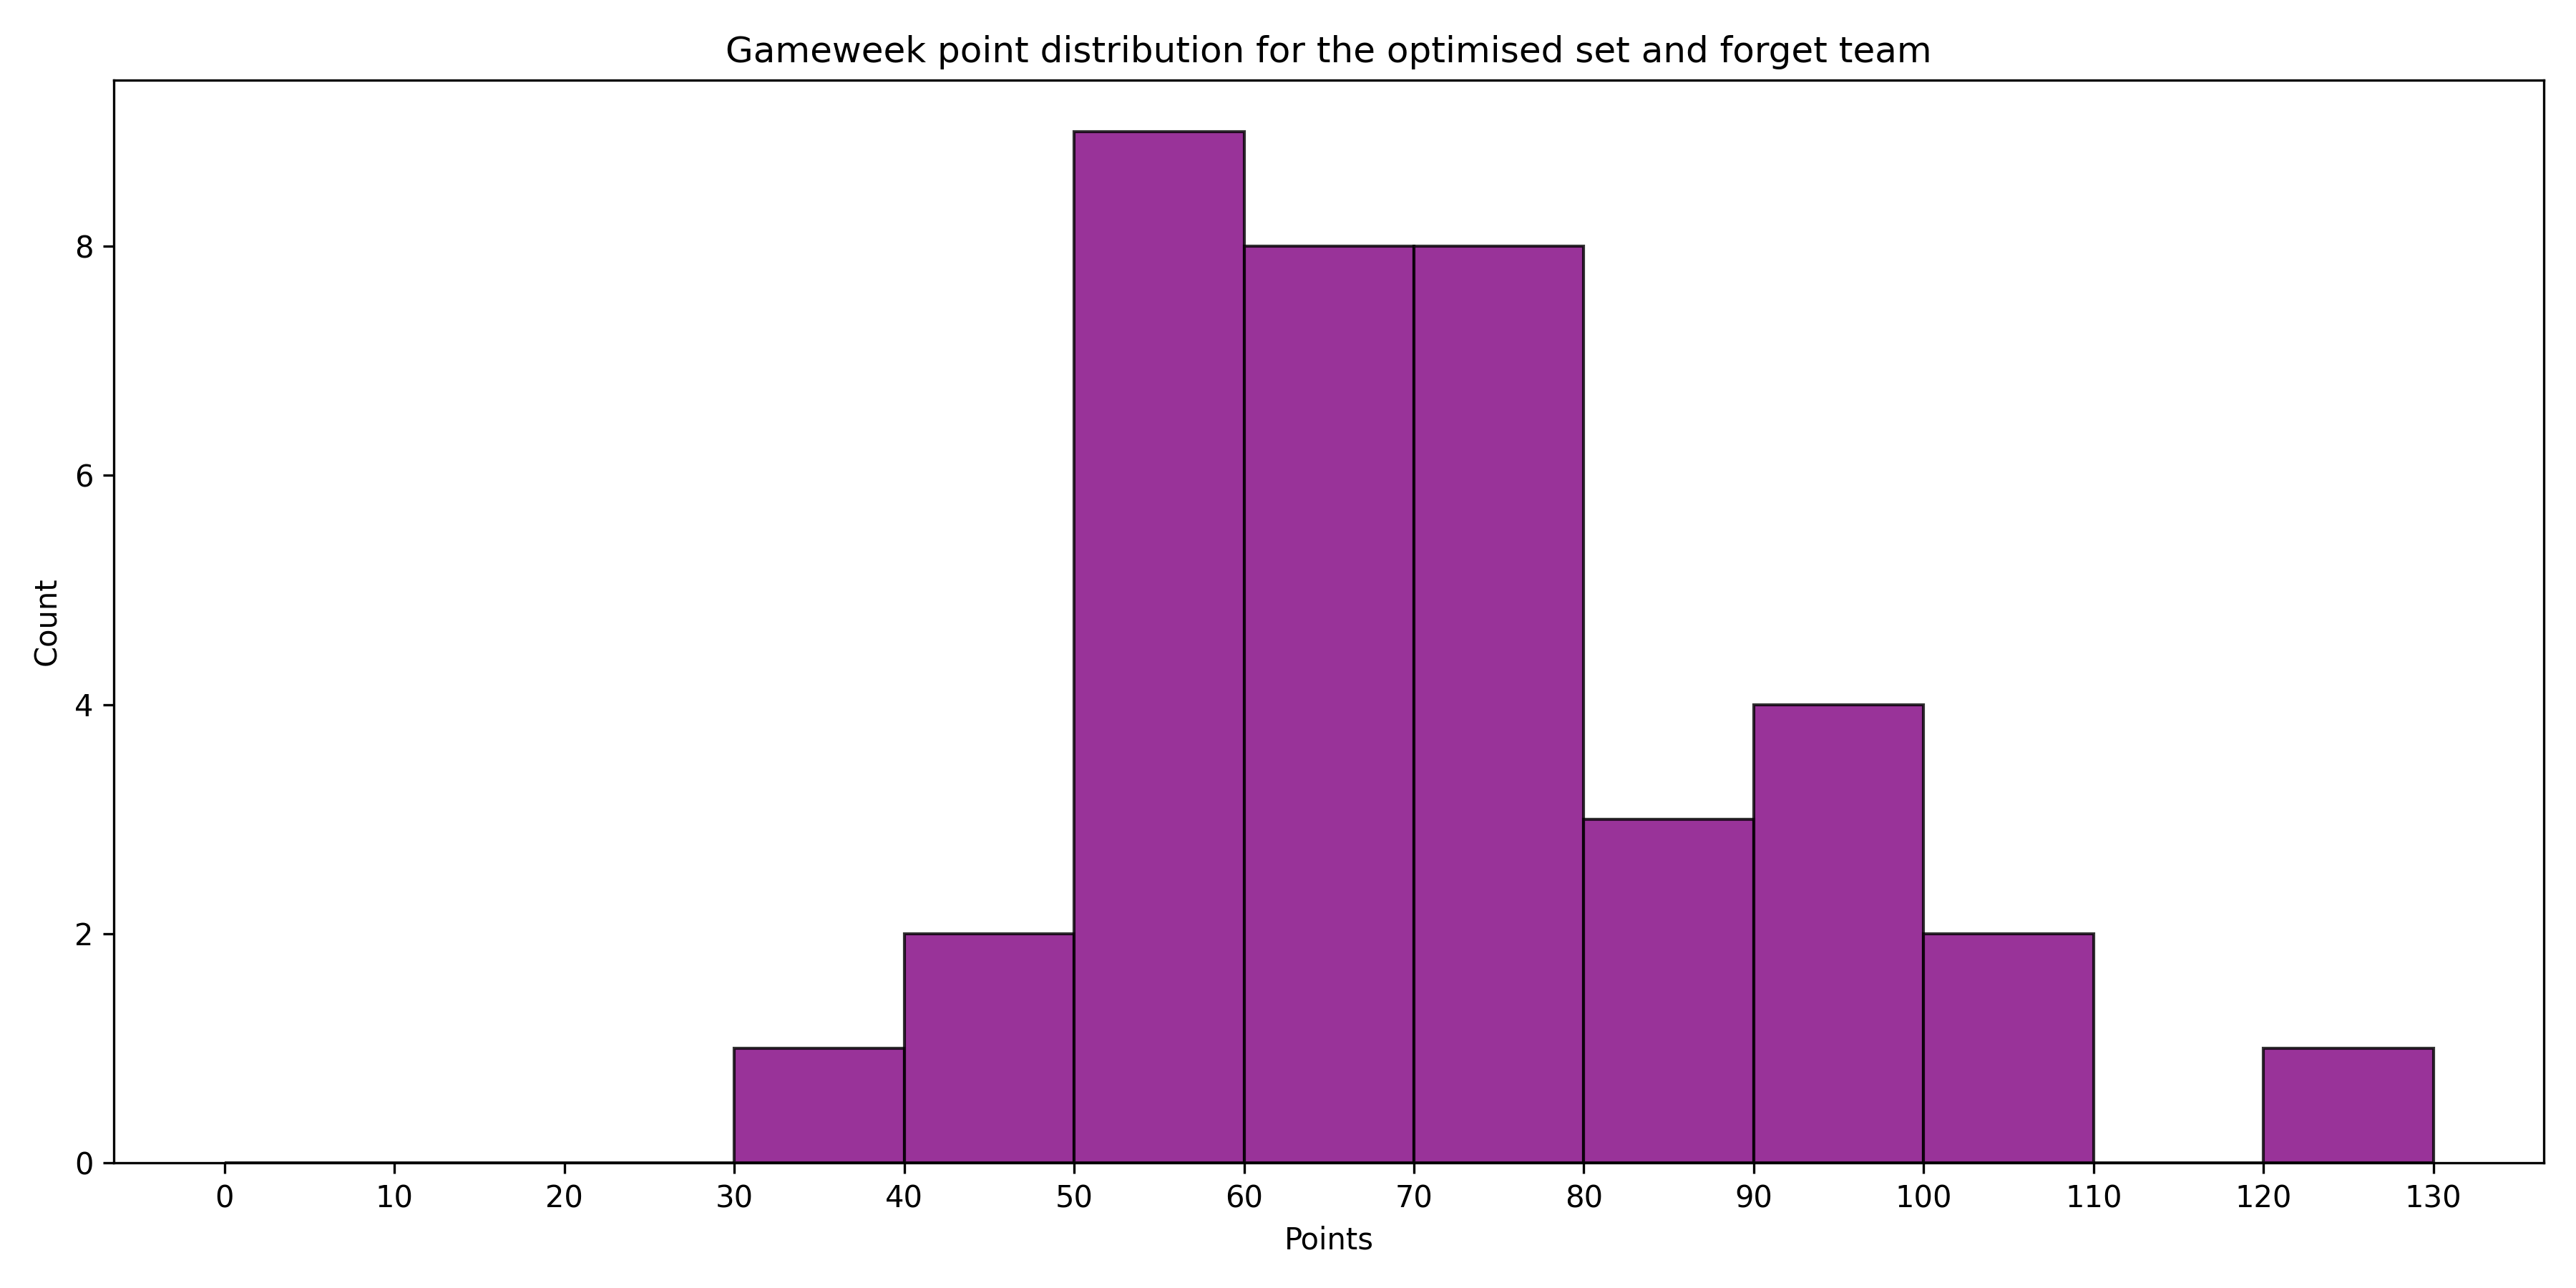 Figure 3. Distribution of points scored by the optimal team.
The bell curve peaks somewhere around the 60 to 75 mark, which feels very familiar. We just saw fewer massive outlier weeks at the very top compared to last year. The squad was simply a bit more volatile overall.
The Mohamed Salah Problem
Cole Palmer wore the captain's armband in 23/24. He bagged 244 raw points which doubled to 488. It was a brilliant pick that felt like a reasonable chunk of the team's total success.
This time around the algorithm slapped the armband onto Mohamed Salah. He scored 344 raw FPL points across the season. It was one of the most absurd individual campaigns in recent FPL memory. Thanks to the permanent captaincy he fed a colossal 688 points into the team total. That's 26% of the entire squad's output from one guy.
Gameweek 24 showed exactly how overpowered this was. Salah had a double-gameweek fixture and racked up 29 points across two matches. The captain double inflated that to 58 points in a single week. Mix in a 17-point haul from Chris Wood and a bunch of clean sheets from Bowen, Muñoz and the defensive assets and the team cruised to an easy 124 points.
Relying this heavily on one player is exactly why hindsight optimisation is so entertaining. You already know who is going to destroy the league so you bet the house on them. Initially I was going to say that nobody in their right mind would lock in a £12.5m Salah as a permanent captain during pre-season with the absolute certainty this model does, but maybe that's underselling it given his FPL history. Ultimately however, with a crystal ball it's the easiest decision ever.
Bryan Mbeumo was on vice-captain duty and scored 236 raw points. He stepped up nicely when Salah took a breather and ultimately added 249 points to the total once those promotions were counted.
Figure 4 visualizes the full player breakdown across all 38 gameweeks.
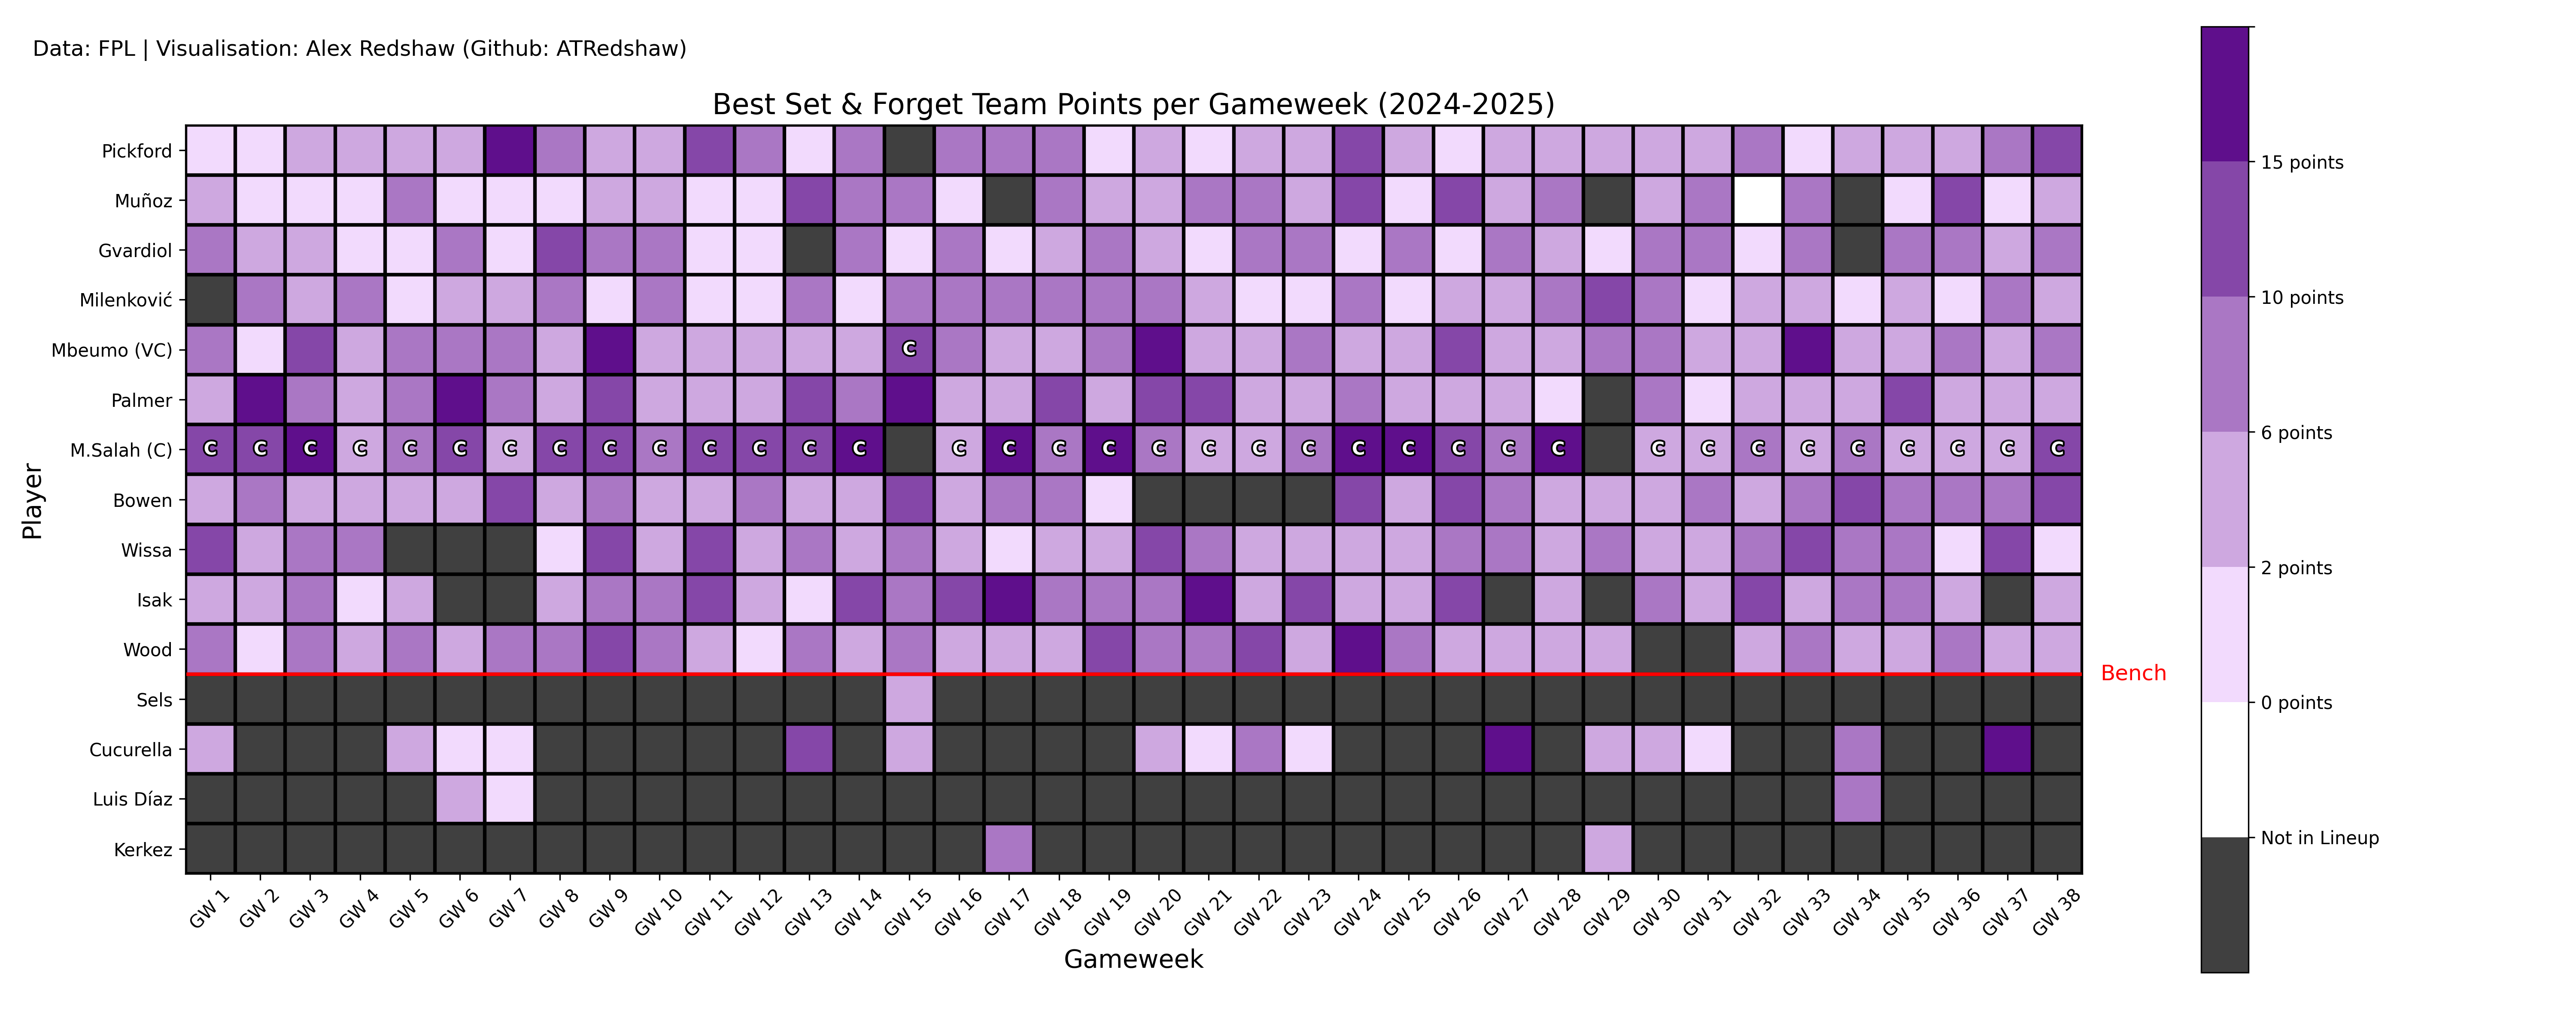 Figure 4. Breakdown of players' contribution to the total points tally.
I love this diagram, it remains my favourite style I've ever produced, but... It brings me great pain looking back at the missing C on Mbeumo for Gameweek 29 when Salah blanked, it made my question when writing this up why, with a better GW15 score, Palmer wasn't vice captain and if my algorithm was wrong. Alas, the choice is right but the diagram is missing that GW29 label for whatever reason, and it will frustrate me till my dying breath (or when I can just be bother to actually fix it...). Just imagine there is a C on Mbeumo in that week for the sake of my sanity.
The Dream Team
Here is the final squad of fifteen.
GK Pickford (Everton, £5.0m) 158 pts
DEF Muñoz (Crystal Palace, £5.0m), Gvardiol (Man City, £6.0m), Milenković (Nottm Forest, £4.5m)
MID Mbeumo (Brentford, £7.0m, VC), Palmer (Chelsea, £10.5m), Salah (Liverpool, £12.5m, C), Bowen (West Ham, £7.5m)
FWD Wissa (Brentford, £6.0m), Isak (Newcastle, £8.5m), Wood (Nottm Forest, £6.0m)
Bench Sels (Nottm Forest, £4.5m), Cucurella (Chelsea, £5.0m), Luis Díaz (Liverpool, £7.5m), Kerkez (Bournemouth, £4.5m)
Total cost was exactly £100.0m.
A couple of details jump out. Nottingham Forest maxed out their club limit with three players. Milenković, Wood, and bench keeper Sels all made the cut. Arsenal claimed that honor last year with Gabriel, Saliba and Ben White. Seeing the maths swap a premium Arsenal defense for Nottingham Forest is a pretty funny reflection given the positions of the teams in seasons prior.
Brentford also secured two spots with Mbeumo and Wissa. Spending limited budget on two guys from a mid-table team just means the algorithm found their combined value impossible to ignore at those price points.
Forwards Flip the Script
Figure 5 breaks down the points by position.
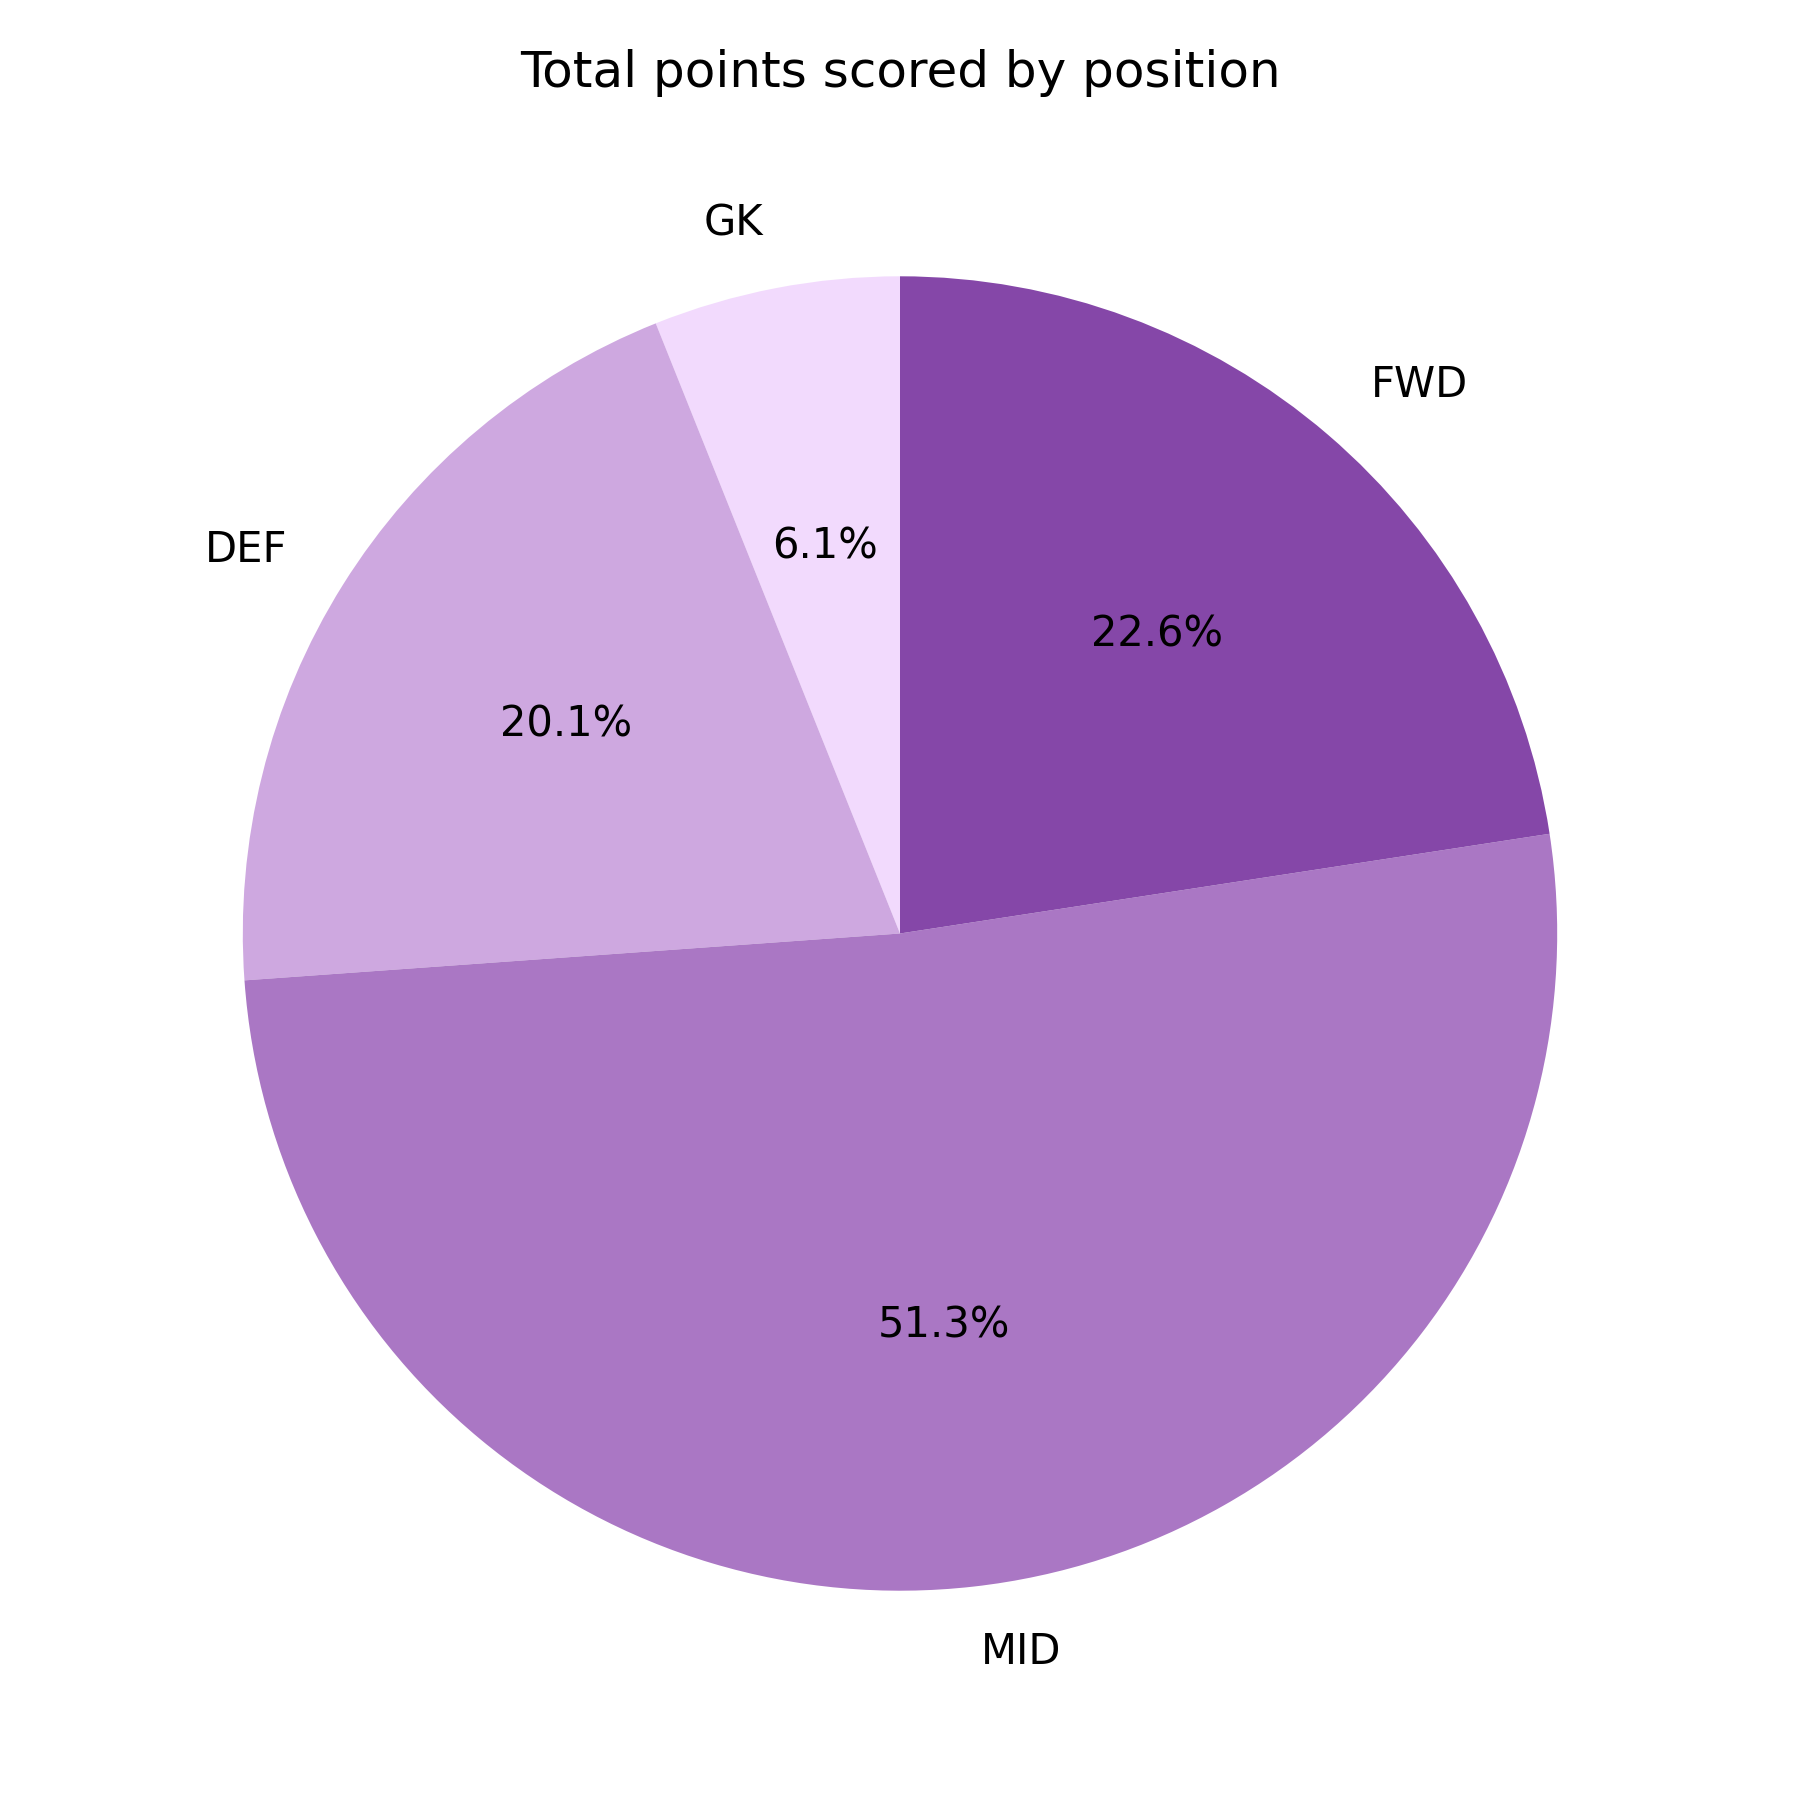 Figure 5. Total points scored by each position.
I noticed last year that defenders heavily outscored forwards. The Arsenal backline was an absolute cheat code back then.
That dynamic completely flipped in 24/25. Forwards racked up 596 points against the defenders' 530. Isak, Wood and Wissa delivered a brilliant spread of goals all season. Meanwhile the premium defenders just lacked the massive upside we saw the year prior.
Midfield still bullied everyone else with 1,354 points, which is 51% of the total. That's honestly just the Salah effect. If you remove his 688 points the midfield looks completely average (it doesn't but you get the points, he's a cheat code).
The Bench Did Very Little
This is the wildest difference between the two experiments.
Jean-Philippe Mateta was the ultimate bench hero last year. He went on a crazy run of form late in the season and kept getting auto-subbed in for massive hauls. The 23/24 bench dragged in around 190 points overall.
The 24/25 bench barely broke a sweat. They managed 102 points. Cucurella did most of the heavy lifting with 80 points because Chelsea's constant rotation accidentally gave him minutes in exactly the right gameweeks. Sels, Luis Díaz and Kerkez scraped together a miserable 22 points combined.
Ultimately, the captain was way stronger this year but the lack of need for substitutions in most gameweeks completely nullified the advantage. The starting eleven did all the work while the reserves just watched.
Figure 6 maps out every single player's contribution.
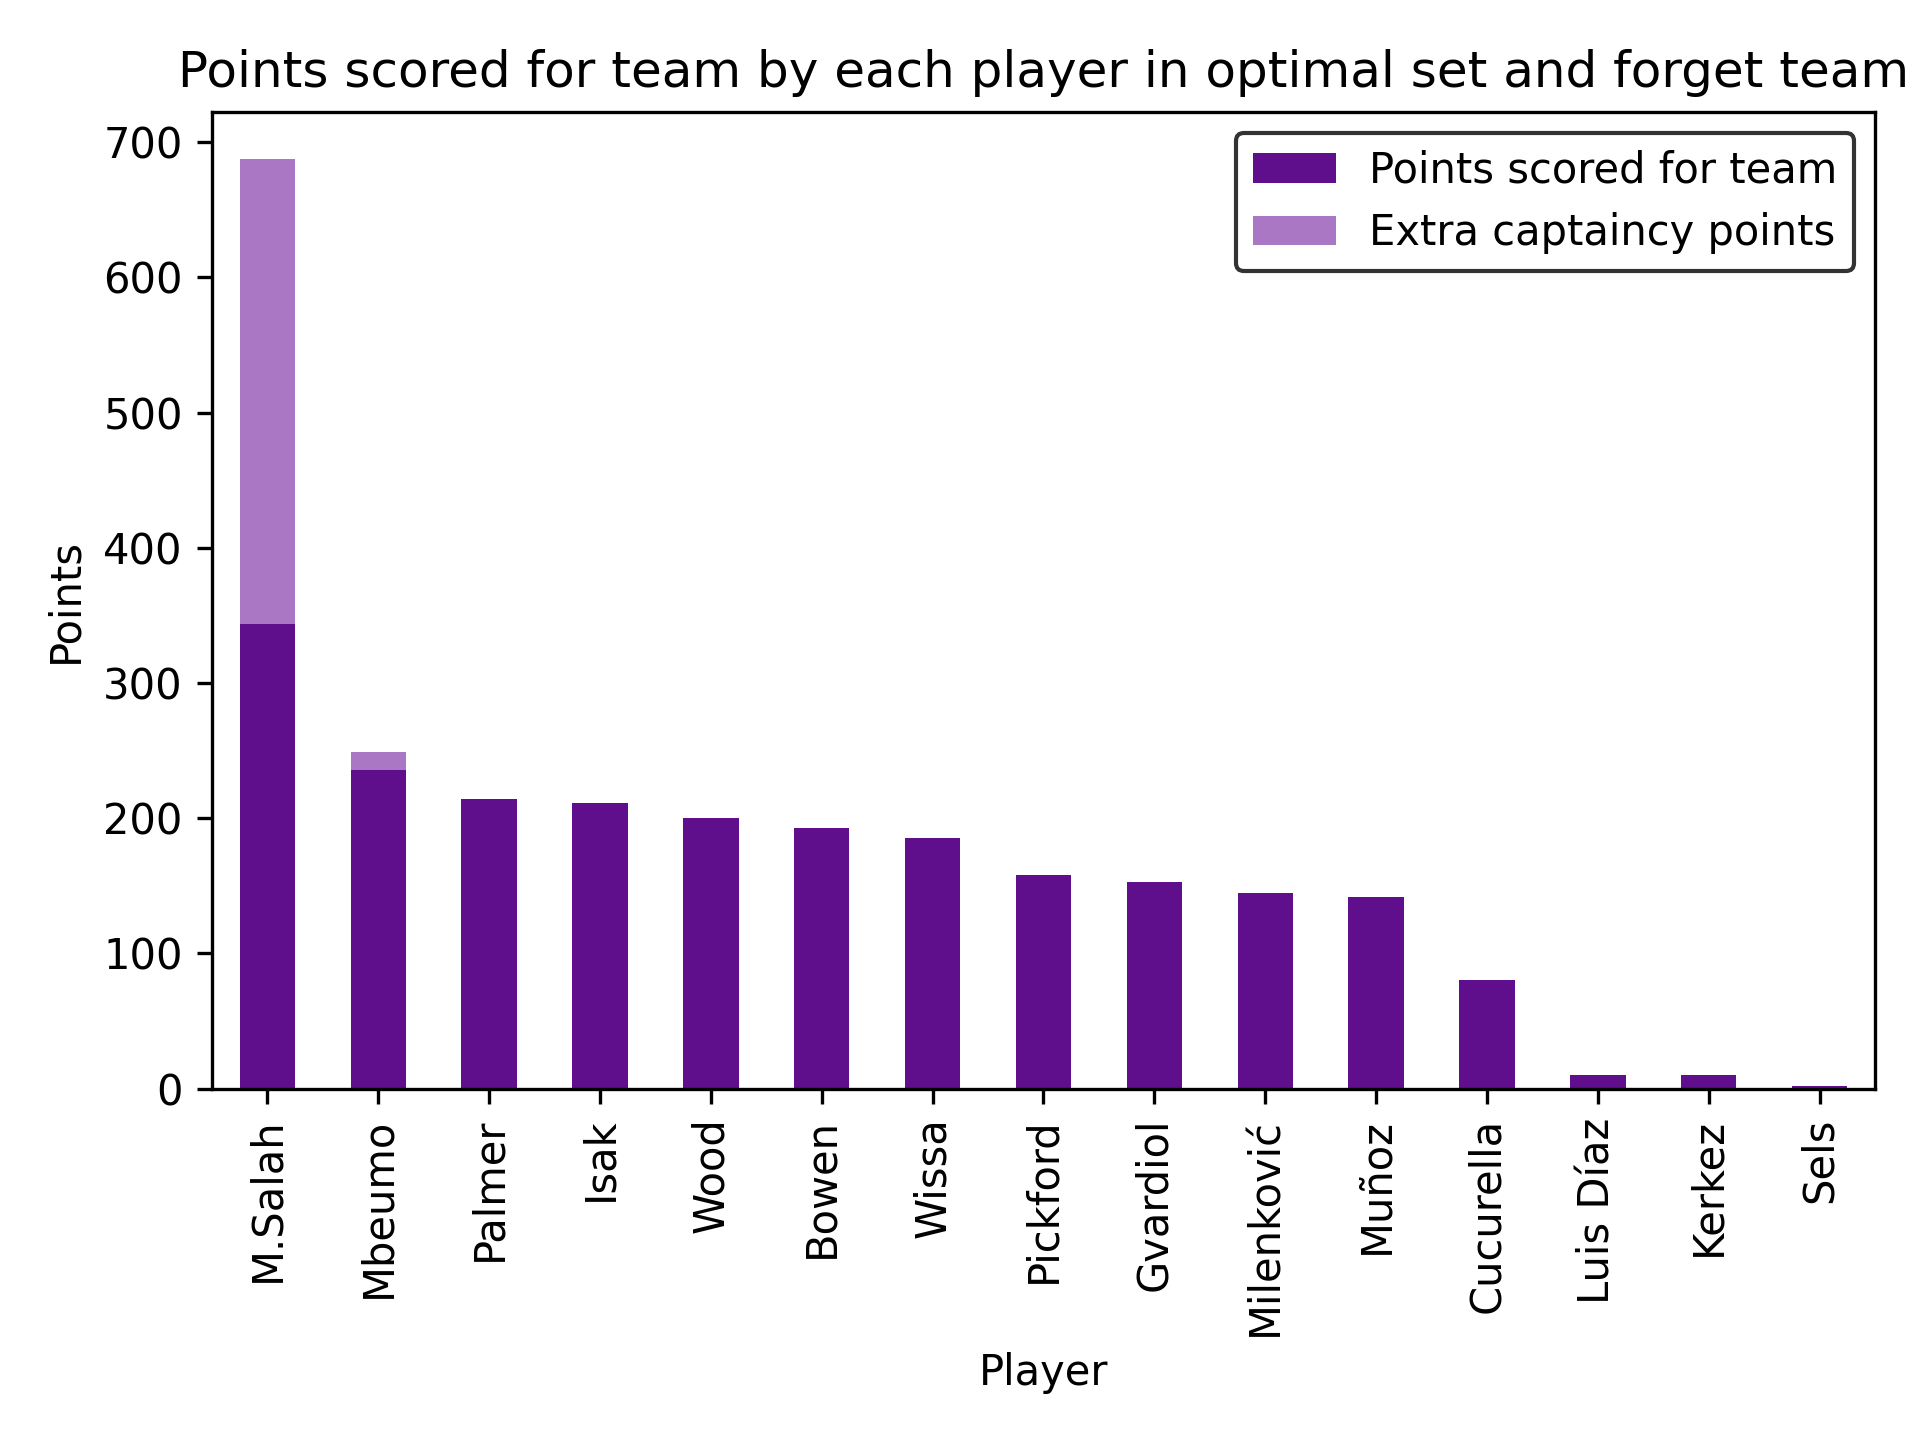 Figure 6. Total points scored by each player in the optimal setup.
Two Seasons and One Depressing Reality
This set-and-forget model has now landed within 16 points of itself across two totally different seasons. It hit 2,656 then 2,640. The maths is rock solid. The actual final rank is the part that hurts.
Going from top 250 down to 1,667th proves the game is getting harder. More managers are using systematic approaches and taking this stuff way too seriously. It also proves that perfect hindsight only shows you the absolute ceiling. Or so, that's what they want you to think, but in reality it's probably just down to variance between the seasons.
The best thing about the algorithm is that it never tilts. It doesn't rage-transfer a player out after one bad week. It doesn't chase last week's lucky hat-trick hero. It just picks a good team and goes to sleep. Finding out that literally doing nothing could theoretically put you in the top 0.015% of global managers two years in a row is equally hilarious and defeating.
What Happens Next
The plan remains the same. The hindsight engine is a fun toy but it's just a theoretical baseline.
I want to turn this into a tool that actually looks forward. The goal is a model that digests historical data, fixture difficulty, and stats to spit out decent transfer advice before the deadline hits.
Another fun idea is a rolling optimisation. Instead of locking in a static squad for 38 weeks I could let the code make one transfer per gameweek. Finding the true maximum score under real FPL rules would be fascinating. That final number would absolutely dwarf 2,640.
Until I build that out the takeaway from two years of data is clear. If you are ever unsure of what to do with your FPL team, doing nothing at all is a genuinely fantastic strategy. Or just save yourself the stress and don't bother playing in the first place... If only that were a viable option.